It all started, as it often does, with a simple hosting setup on dedicated servers, hosting customers on the usual suspects: Hetzner, OVH, and the like. As things grew, the natural evolution was to dive deeper into infrastructure — first a few racks in a datacenter (Nova), then IPs and circuits from a provider, and eventually becoming a RIPE LIR member, with my own ASN and IP space. In practice: a truly autonomous presence on the Internet. Hurray! I got my own AS 🙂
But then came the next question:
Wait a minute, I have my own network now!
What’s entering and leaving my network?
Am I under attack?
Is anyone probing/enumerating/scanning me ? (Yeah censys, I can see you now)
Which ASNs is my traffic coming from?
Which upstream is getting saturated?
How far am I from Google, Facebook, Cloudflare, or OTEnet?
Which routes am I taking to get where — and through whom?
I’m not an ISP, and I don’t have a multi-thousand-euro budget for proprietary solutions like Kentik. My network is small — a Mikrotik router, modest traffic, and a ton of questions. So my goal became clear: gain visibility and get alerts for flows and routing, with reasonable specs and maximum efficiency.
First Steps: LibreNMS, SNMP — and Its Limits
I started with LibreNMS and SNMP.
I had been using it already for monitoring my dedicated servers. It’s excellent for status monitoring — but not for flow-level insight. I couldn’t tell what was going where, couldn’t see BGP depth, and had zero context around ASN or GeoIP.
So ? What’s next ?
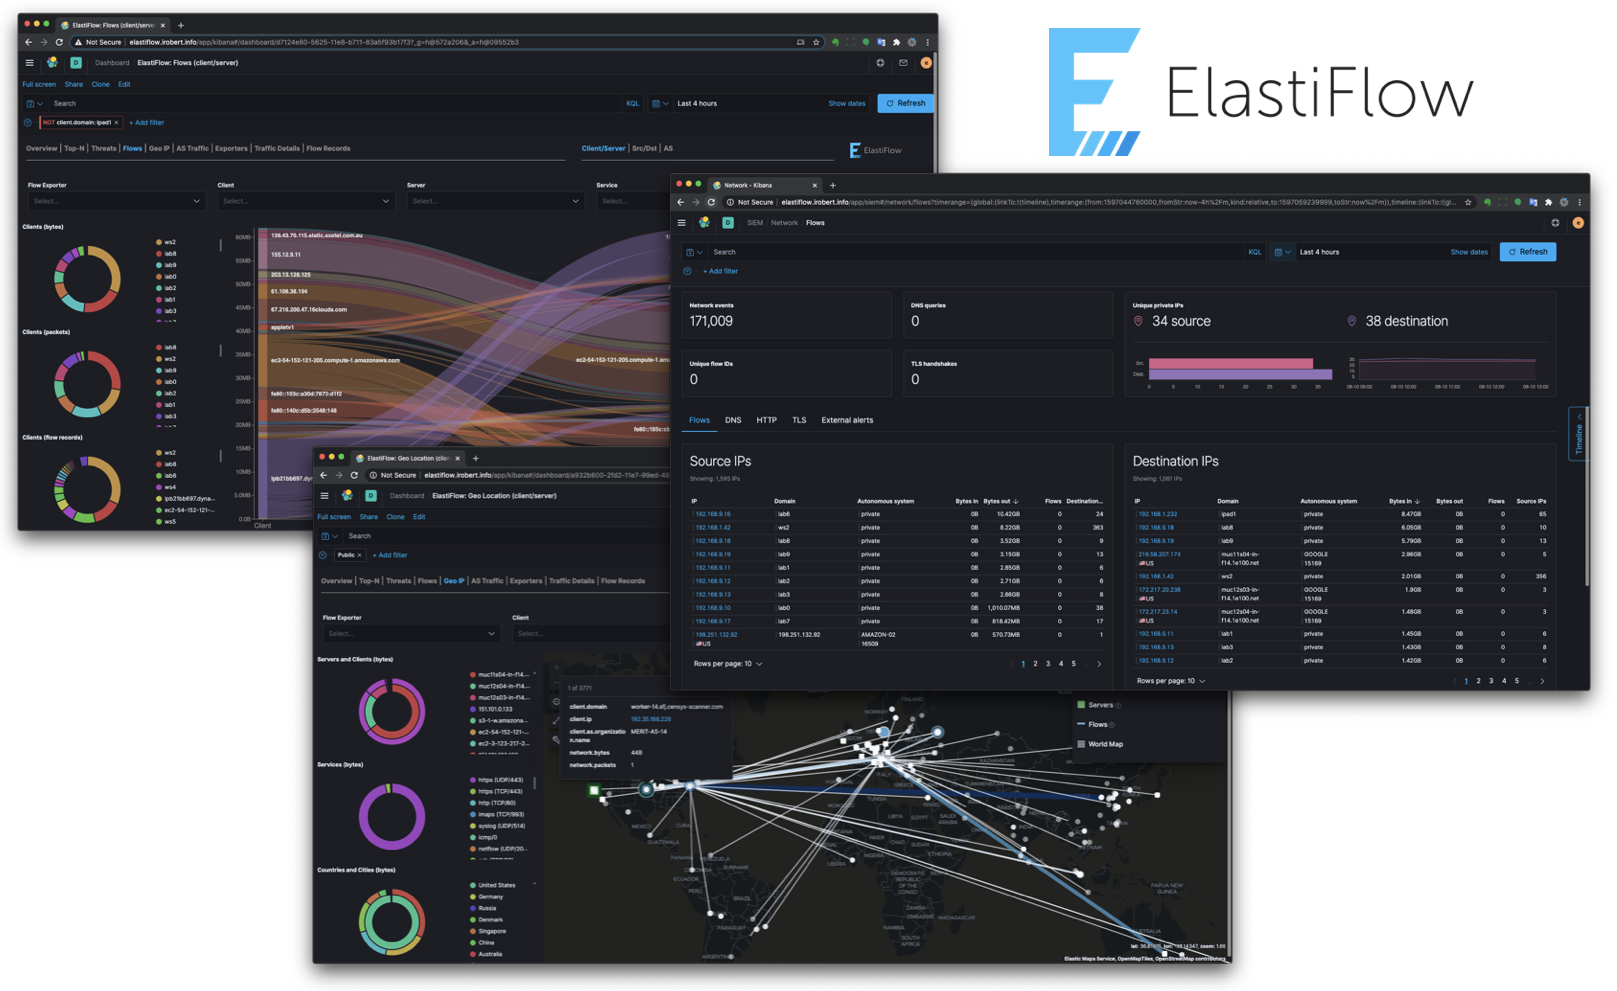
My first Breakthrough! : Elastiflow + ELK Stack
Then I discovered Elastiflow. A stunning Kibana UI with full NetFlow support and dashboards everywhere. The problem?
Resource usage:
-
8+ cores
-
40GB RAM (and more)
-
20+ GB disk/day
Even worse: no BGP enrichment. No AS_PATH, no Next Hop, no Local Preference.
You’d see traffic from Cloudflare… but through which route? Which upstream was carrying the load? No idea.
Next Phase: pmacct + nfacctd + Kafka + ClickHouse (with Python in the Middle)
Then came pmacct — because it could do BGP enrichment! With a passive BGP session, it could see AS_PATH, Next Hop, origin prefixes… everything.
So I built this stack:
-
nfacctdto collect flows -
A Python script for enrichment (GeoIP, ASN, PTR)
-
Kafka to buffer/transport data
-
ClickHouse for storage/analytics
It worked! But there were a lot of moving parts.
Flow → JSON → Kafka → Python → Enrich → ClickHouse
And the problems came quickly:
-
Flow loss during spikes
-
Lag between reception and appearance in the dashboard
-
CPU overload from Python and nfacctd
-
Disk I/O and latency from parsing JSON
The Reboot: GoLang + In-Memory BGP + Zero-Latency Enrichment
This is where flowenricher was born. What started as a simple Python-to-Go rewrite for performance evolved into something more.
First, I built a Kafka consumer to enrich and flush flows to ClickHouse.
Then I integrated GoBGP directly. I no longer needed JSON-based prefix tables — all routing data was now in RAM, updated in real-time.
Eventually, I:
-
Dropped completely pmacct / nfacctd since I’ve made my own flow engine
-
Removed Kafka entirely. The same app receives the flow directly. No need for consumer.
-
Wrote my own NetFlow v9 collector from scratch in Go (yes, I had a lot of free time)
- The same app also brings up a BGP connection to enrich it.
Final Architecture: Simple. Efficient. Powerful.
[Router] → [flowenricher] → [ClickHouse]
Today, flowenricher:
-
Collects NetFlow v9
-
Enriches:
-
ASN & Org Name
-
BGP AS Path, Next Hop, Local Pref
-
GeoIP (Country + City)
-
Reverse DNS (PTR)
-
SNMP Interfaces (input/output interface name)
-
-
Inserts directly into ClickHouse for low-latency analytics
-
Has a built-in detection engine for:
-
Alerting suspicious flows
-
Automatic BGP blackhole announcements
-
Withdraws blackholes after timeout
-
And all this? At zero license cost.
Instead of €2,000/month for Kentik, I built it myself — powered by open source, caffeine, and stubbornness. The entire system runs on a single server in my basement and gives me full AS-level and flow-level visibility with detection and mitigation.
Project: flowenricher
flowenricher is a real-time NetFlow/IPFIX enrichment, detection, and mitigation engine written in Go.
Features:
-
Integrated NetFlow v9 collector
-
ASN + Org enrichment
-
Full BGP AS Path + Next Hop + Local Pref
-
GeoIP Country/City (MaxMind)
-
PTR lookups
-
SNMP enrichment (interface names)
-
ClickHouse integration
-
Config-driven (YAML)
-
Built-in detection engine
-
Automated BGP blackhole + withdraw
-
Optional Kafka support
Built for:
-
Edge visibility
-
Real-time detection
-
Low-latency, high-volume flow processing
-
Small ASNs and hobbyist network engineers
Next Steps? Already made a few!
SNMP Enrichment! Grab interface names from IF index. “Bind” in/out interface with its name <– Done!
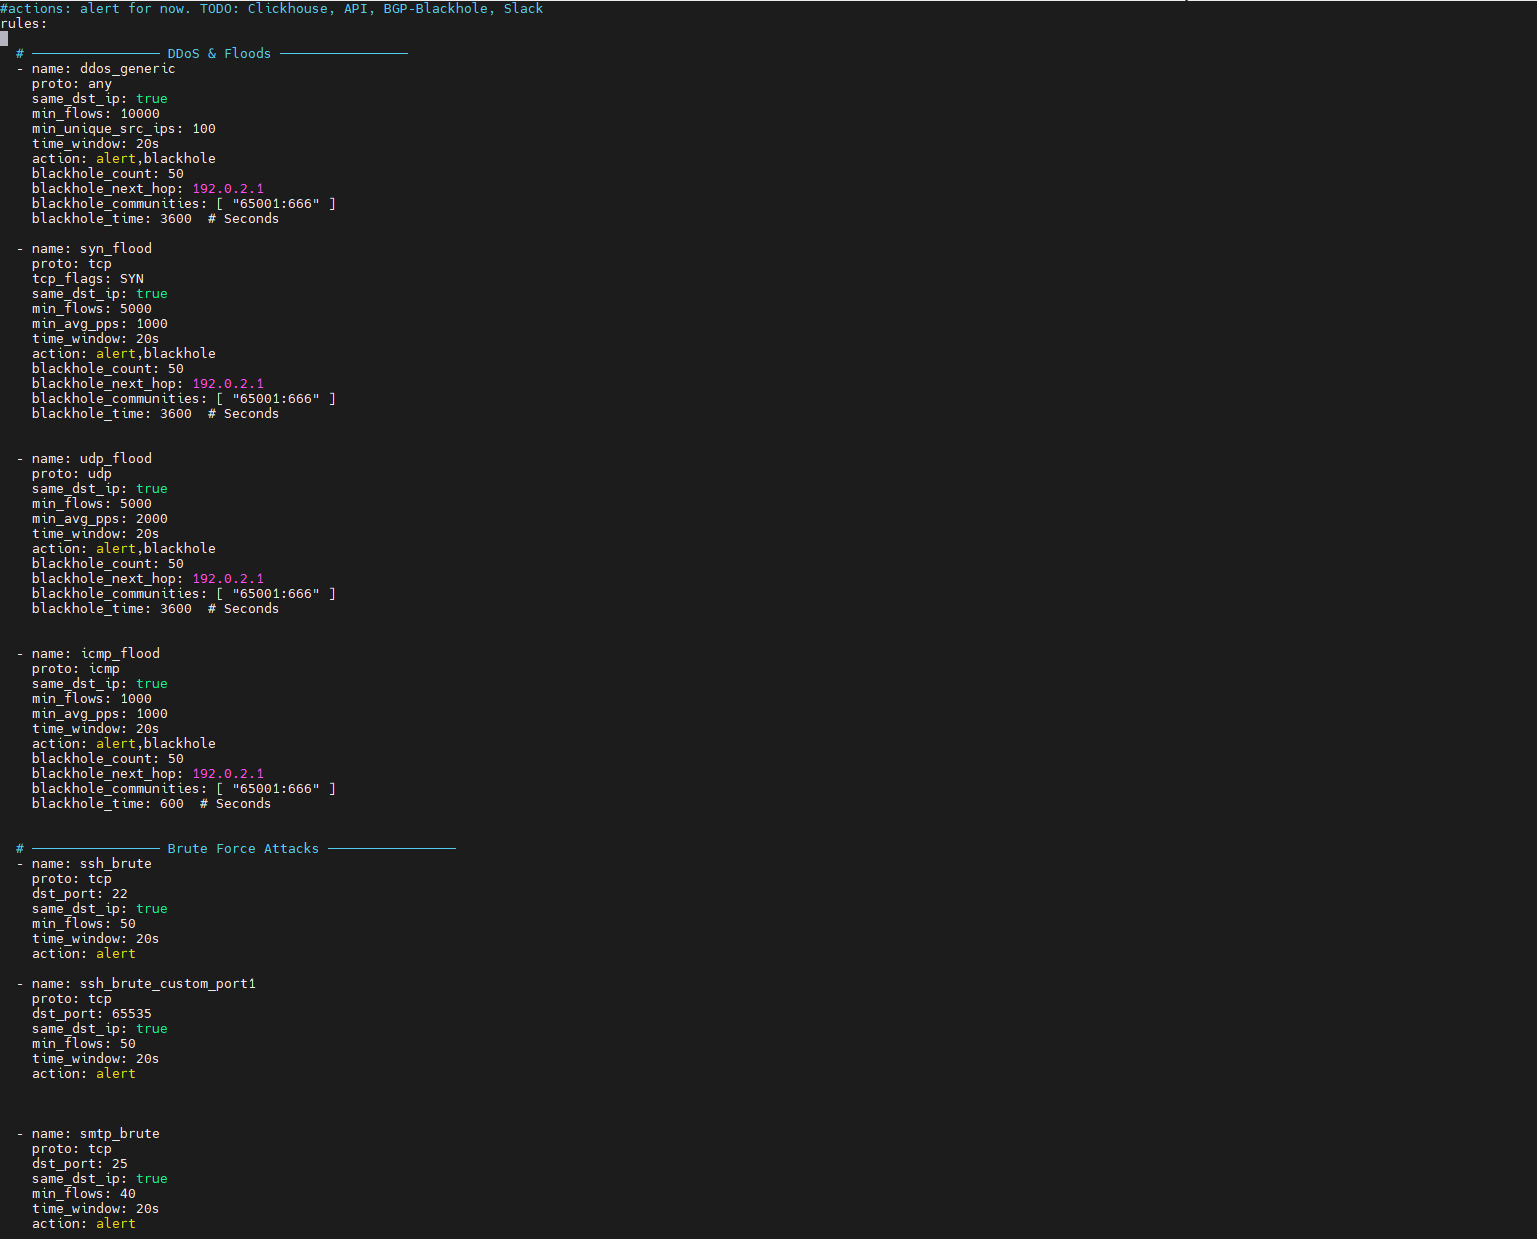
Pattern recognition #1: Internal recon/enumeration/scan/brute force recognition -> And send alerts or IP to API or any channel (slack? CFM?) <— logs is a start.
Pattern recognition #2: Make BGP Active! Detect pps/flow/throughput anomalies -> BGP Blackhole or block or inform to a channel (slack?) <—- Done!
Simple API cli-like environment to ask information (AS PATH for IP, whois, simple stuff) <—- Done!
Detection & Mitigation: It’s Already Here
With the latest version of flowenricher, real-time detection and automated response are no longer “coming soon” — they’re live.
✅ Pattern recognition is active:
The engine can now detect behaviors like horizontal scans, internal recon, brute-force attempts, or DoS attempts — based on customizable thresholds (flows, unique IPs, packets per second, etc.).
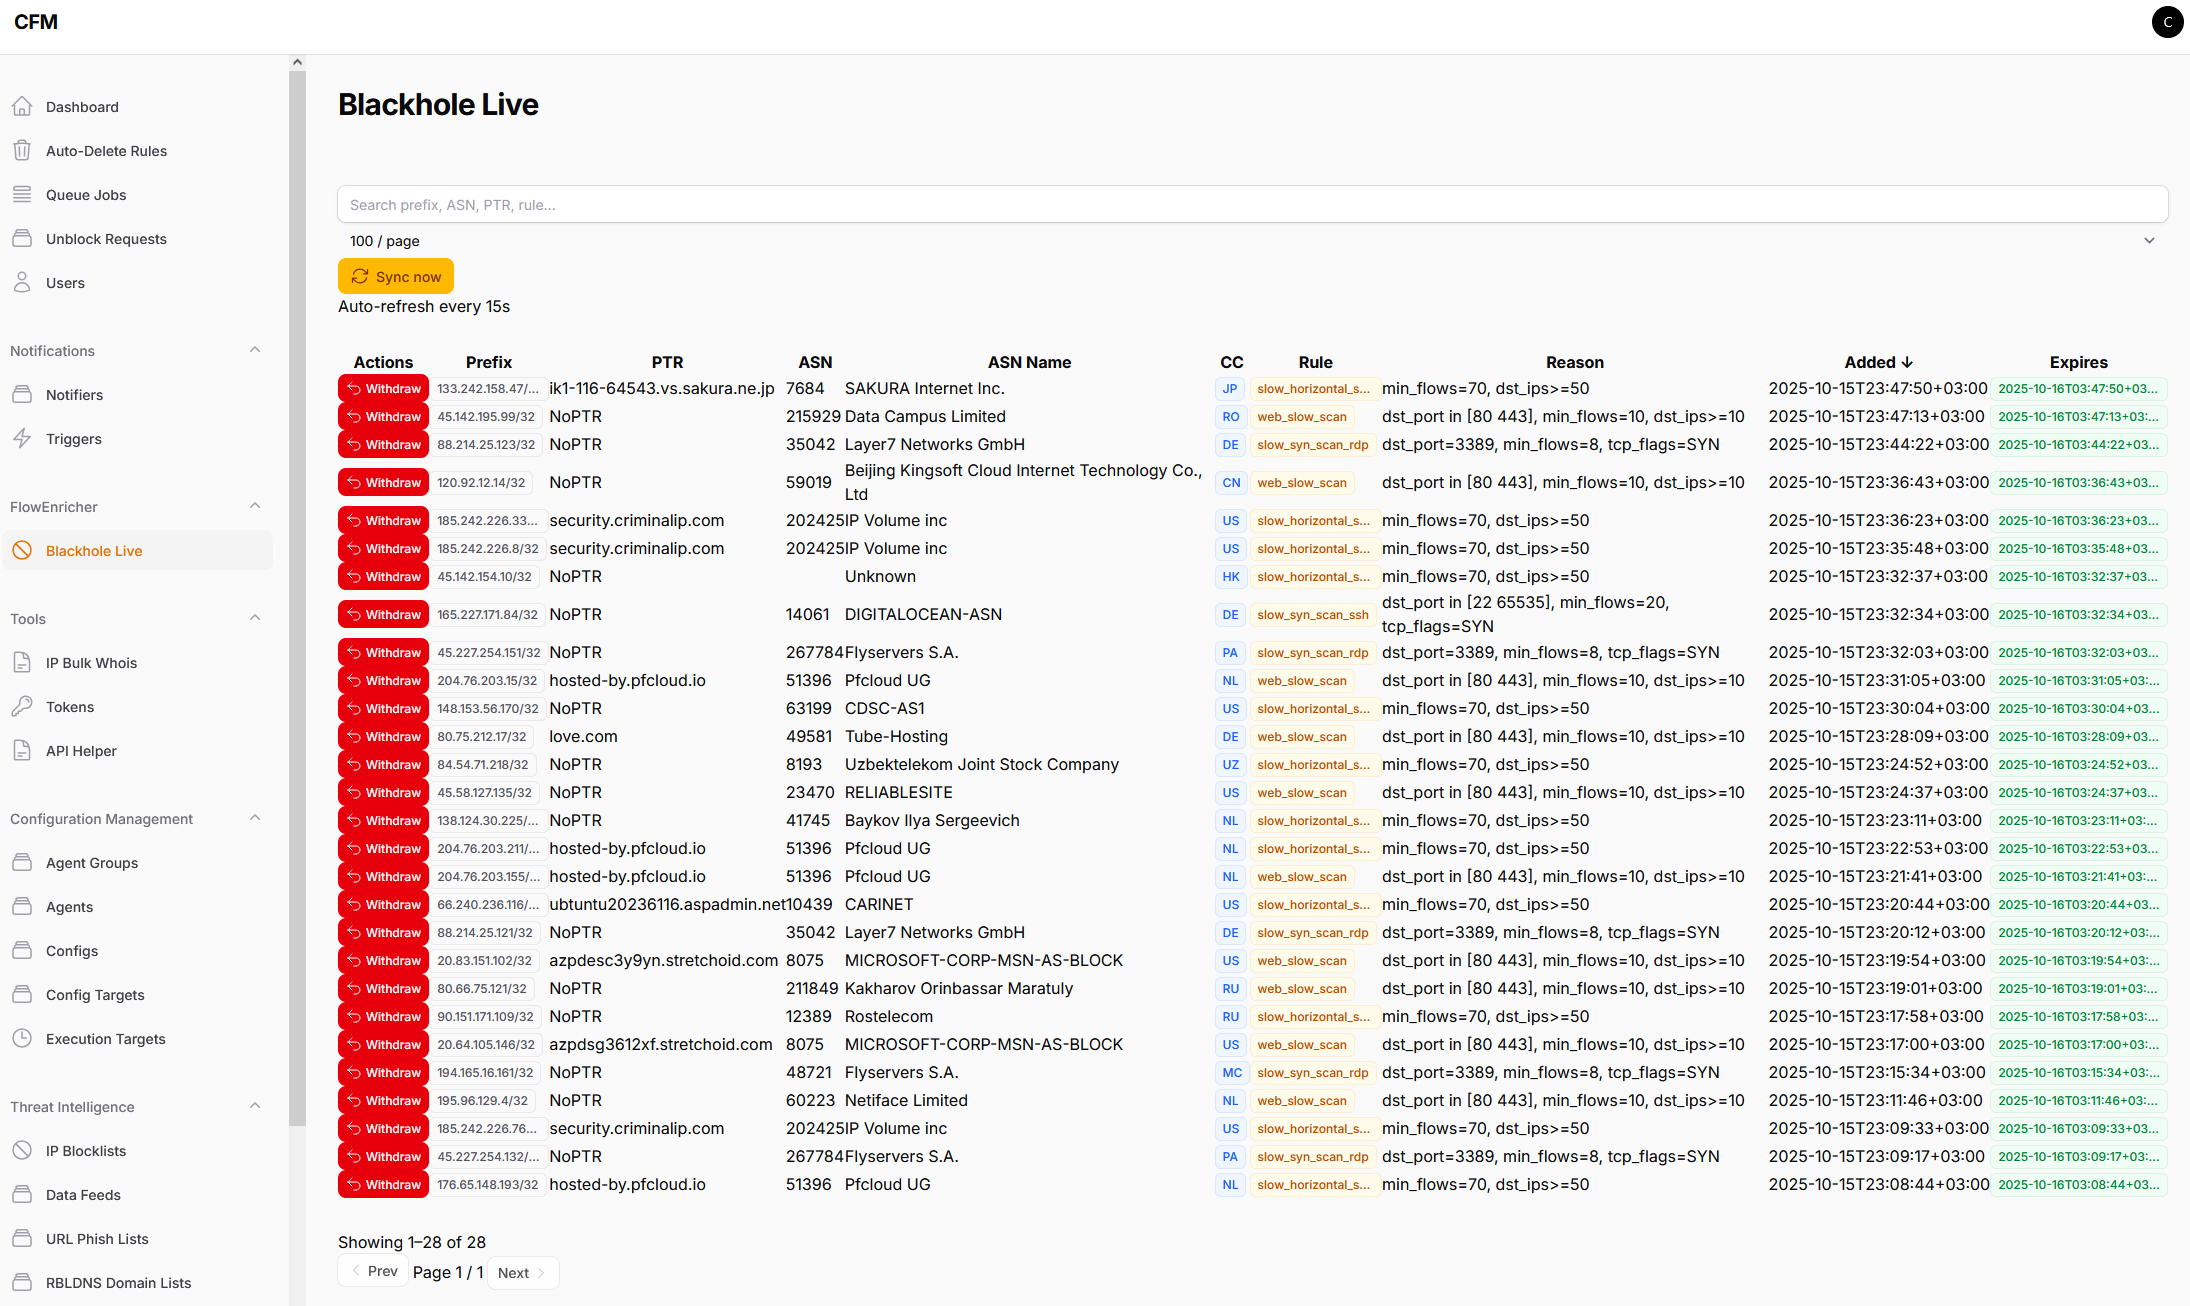
✅ Automated mitigation via BGP Blackhole:
Matched rules can immediately trigger a BGP announcement (e.g., 65001:666 or 216285:666) to blackhole the offending IP at the edge.
Timed withdrawals are supported too — a prefix will automatically be withdrawn after blackhole_time expires.
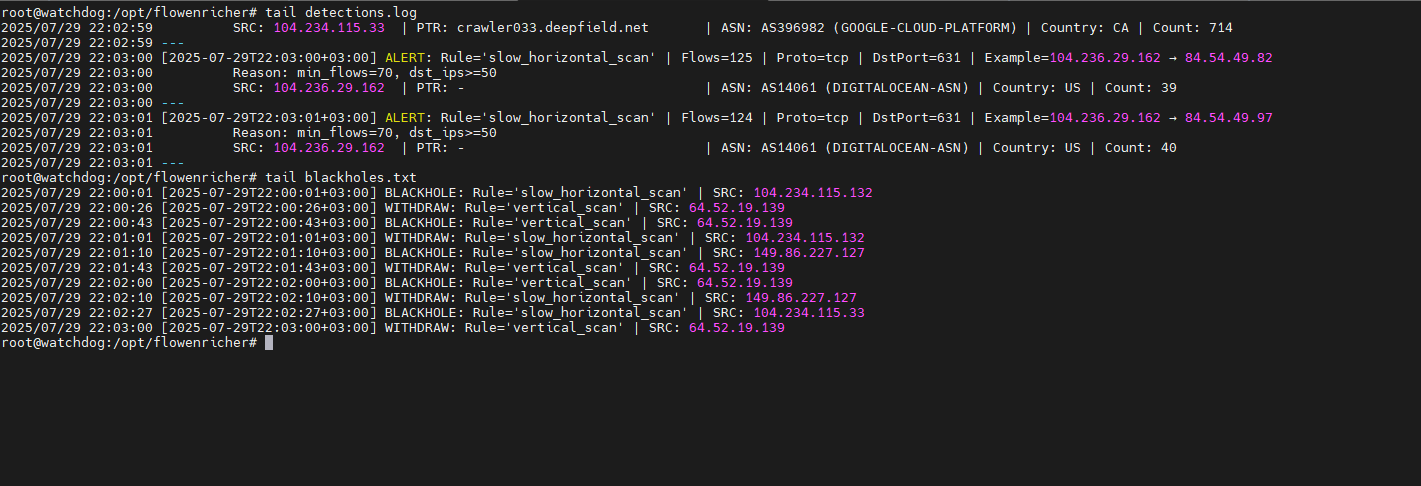
✅ Detection logs + Blackhole logs
-
Every triggered rule is logged to
detections.log -
Blackhole actions are tracked in
blackholes.txt
Got a web interface too! Hurrayyyyy! Linked to my other project, CFM made a page to monitor blackholes:
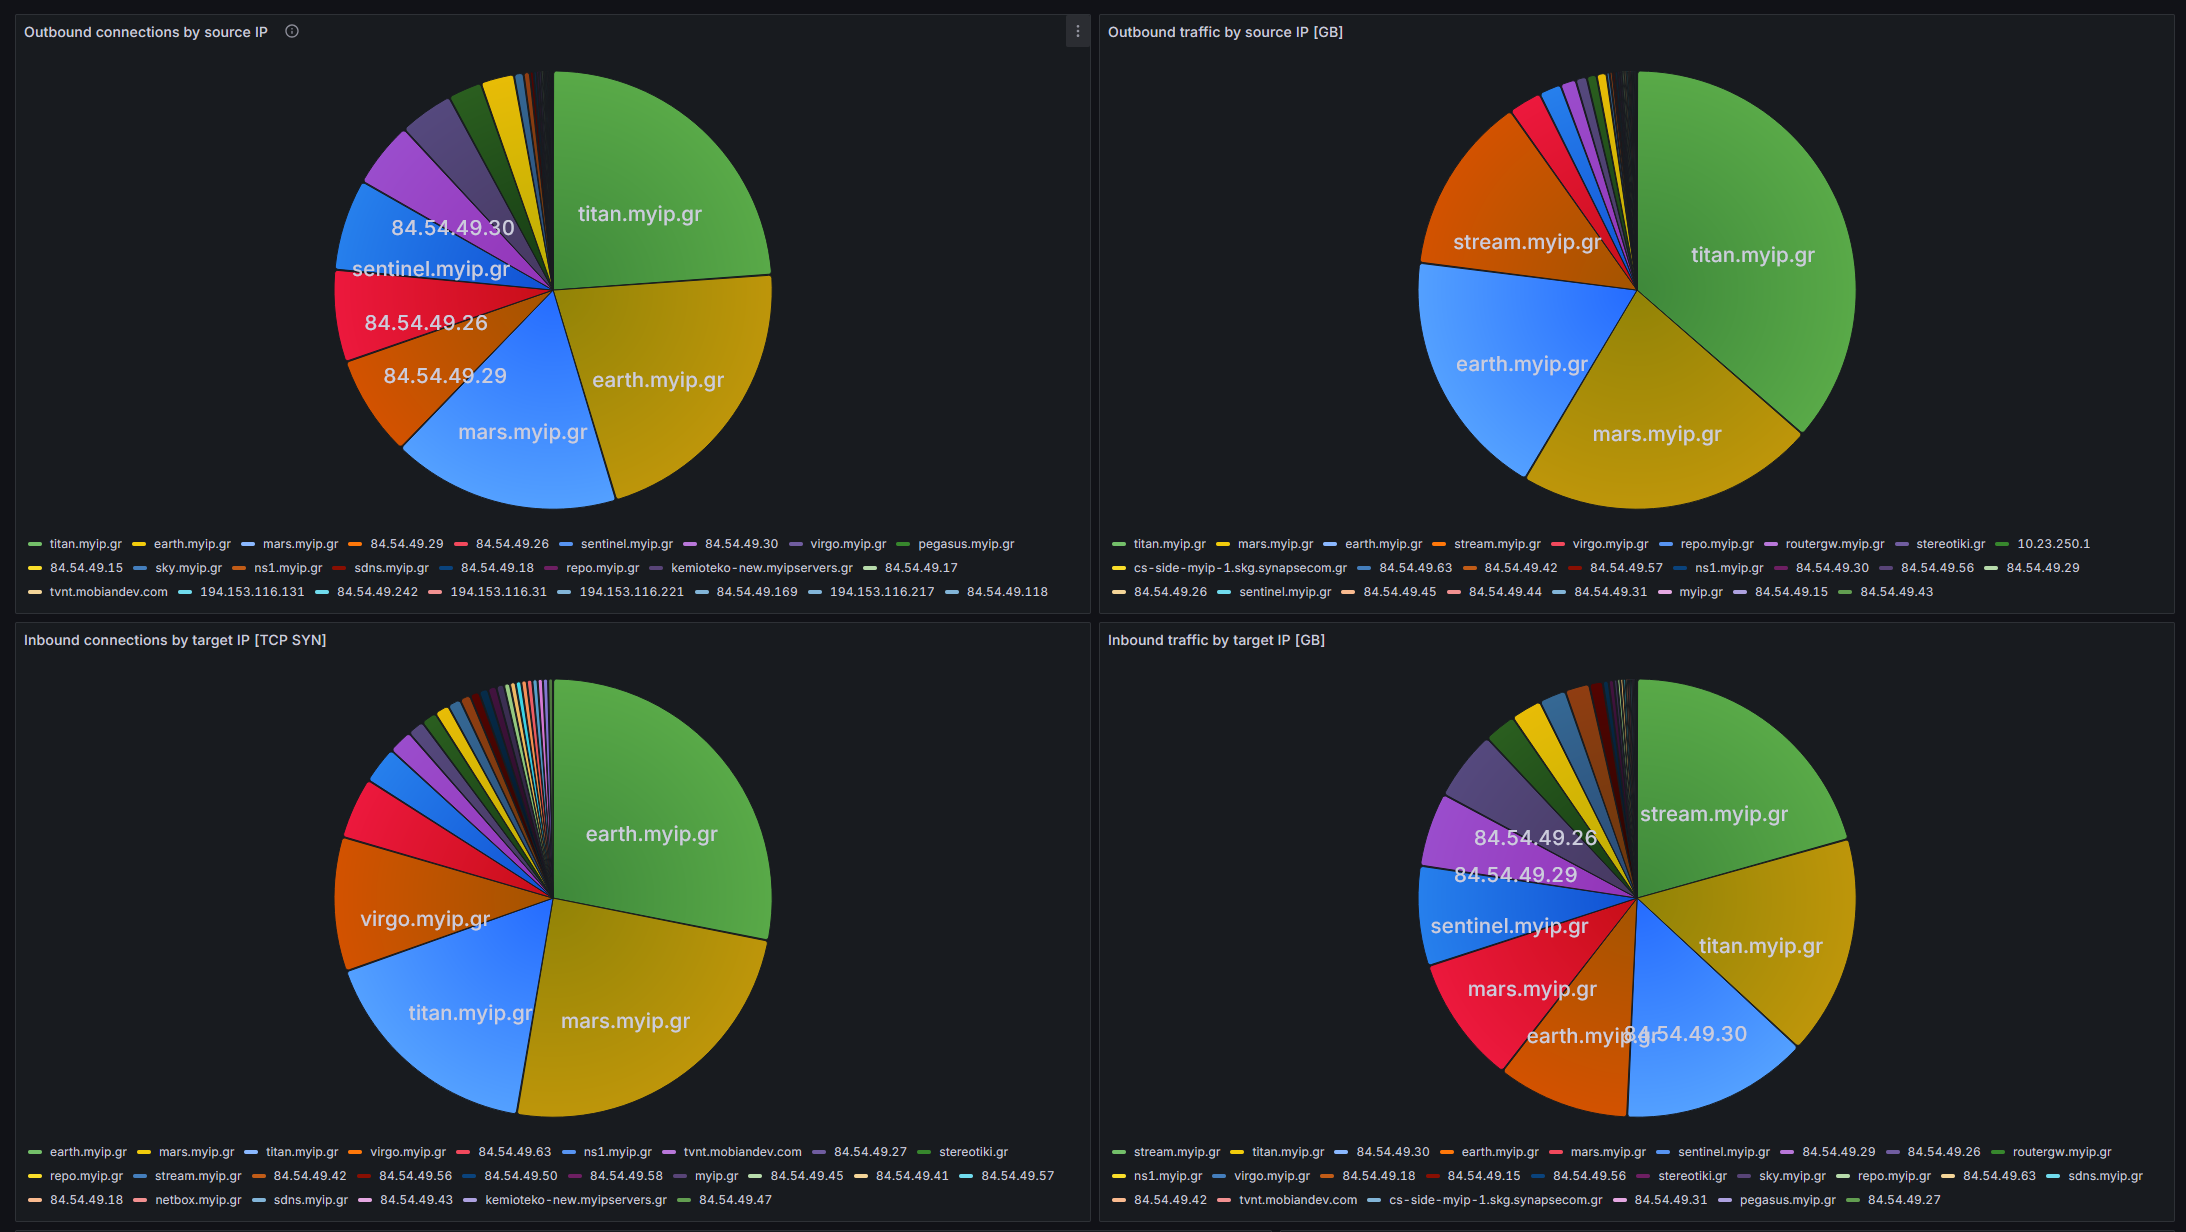
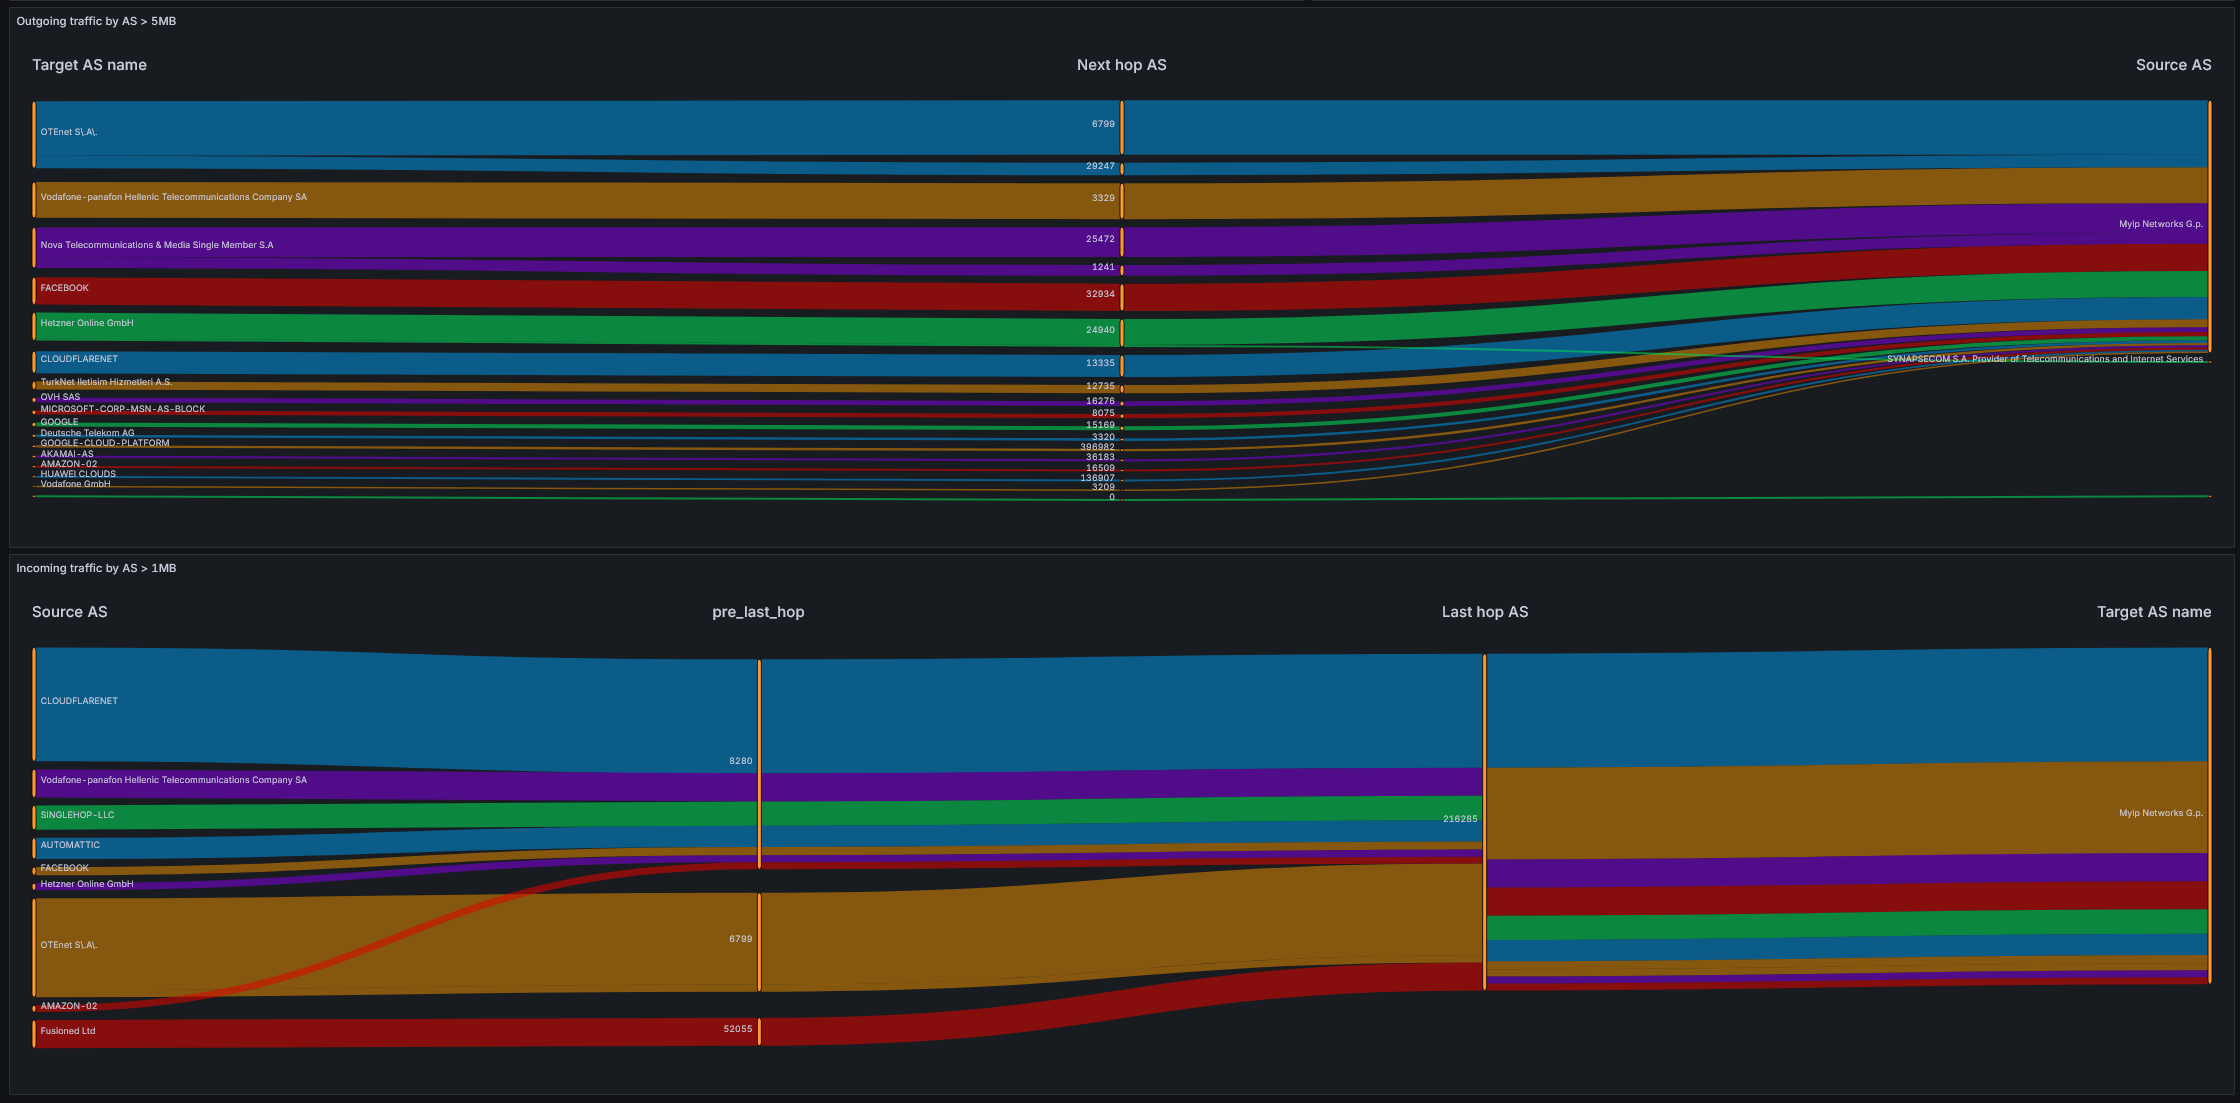
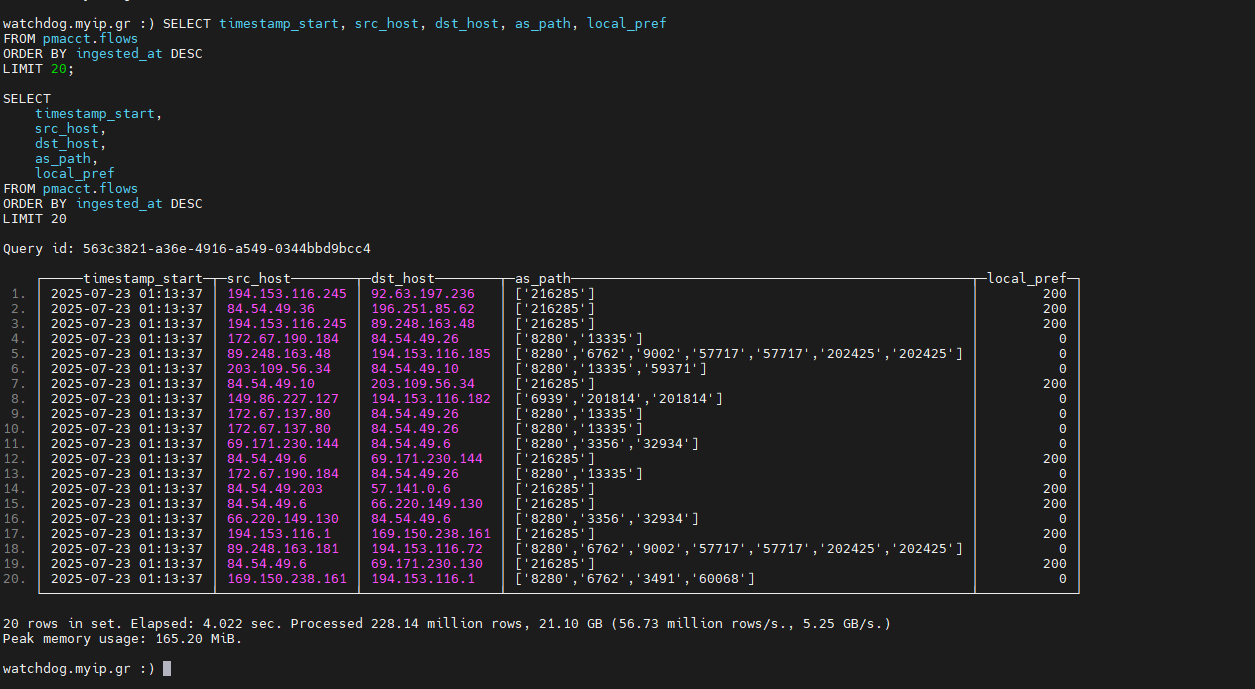
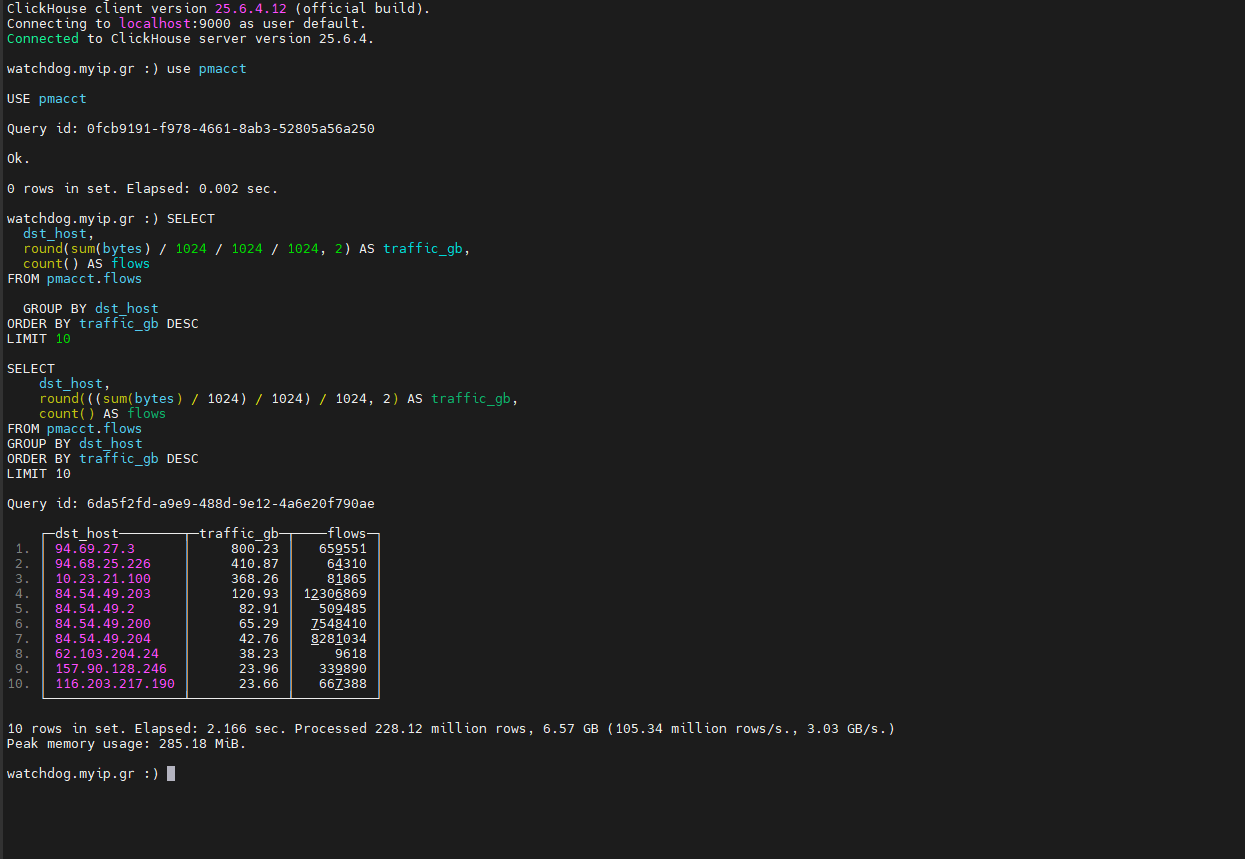
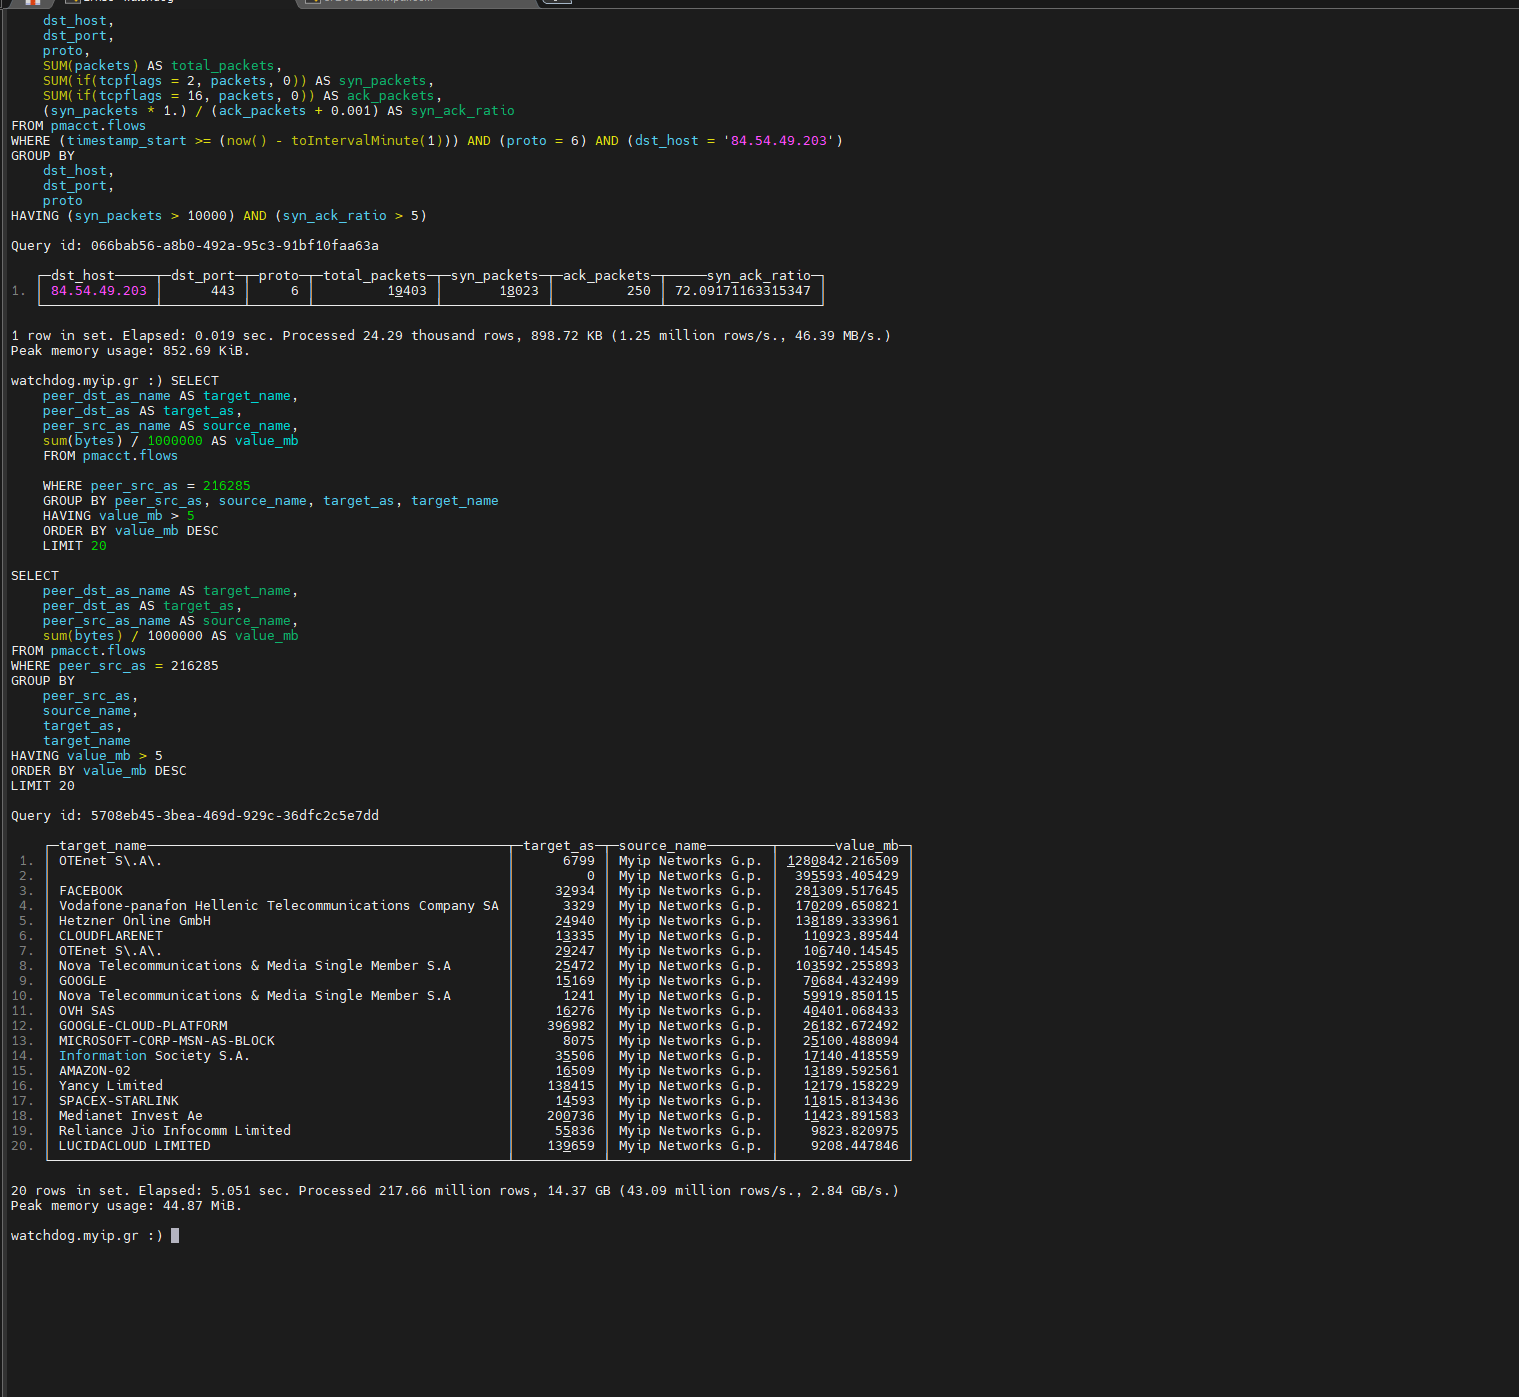
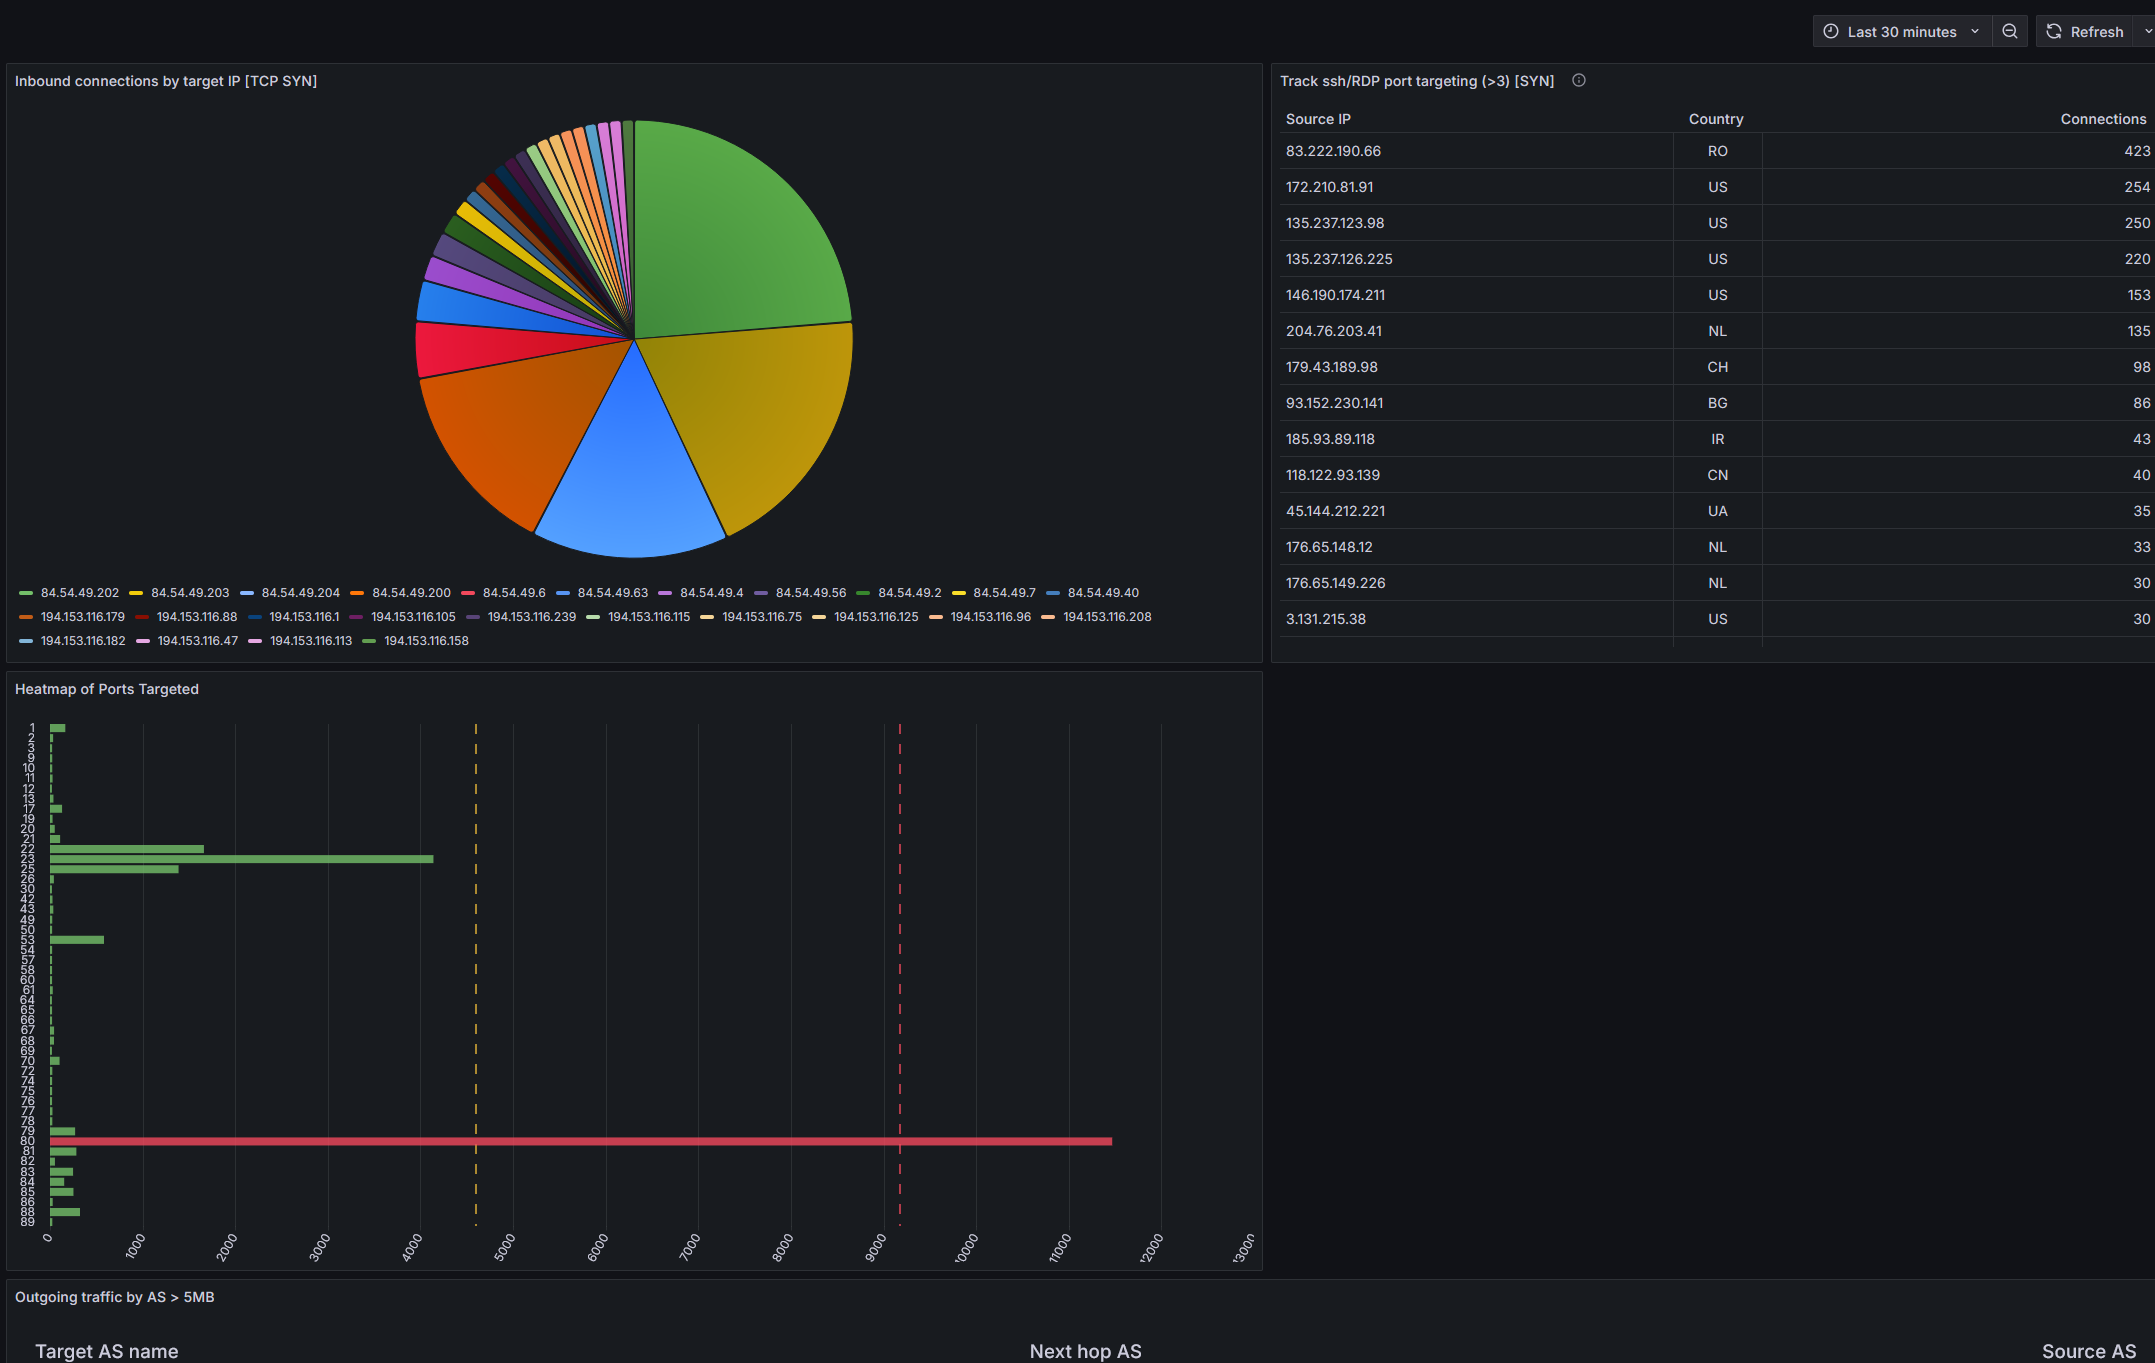
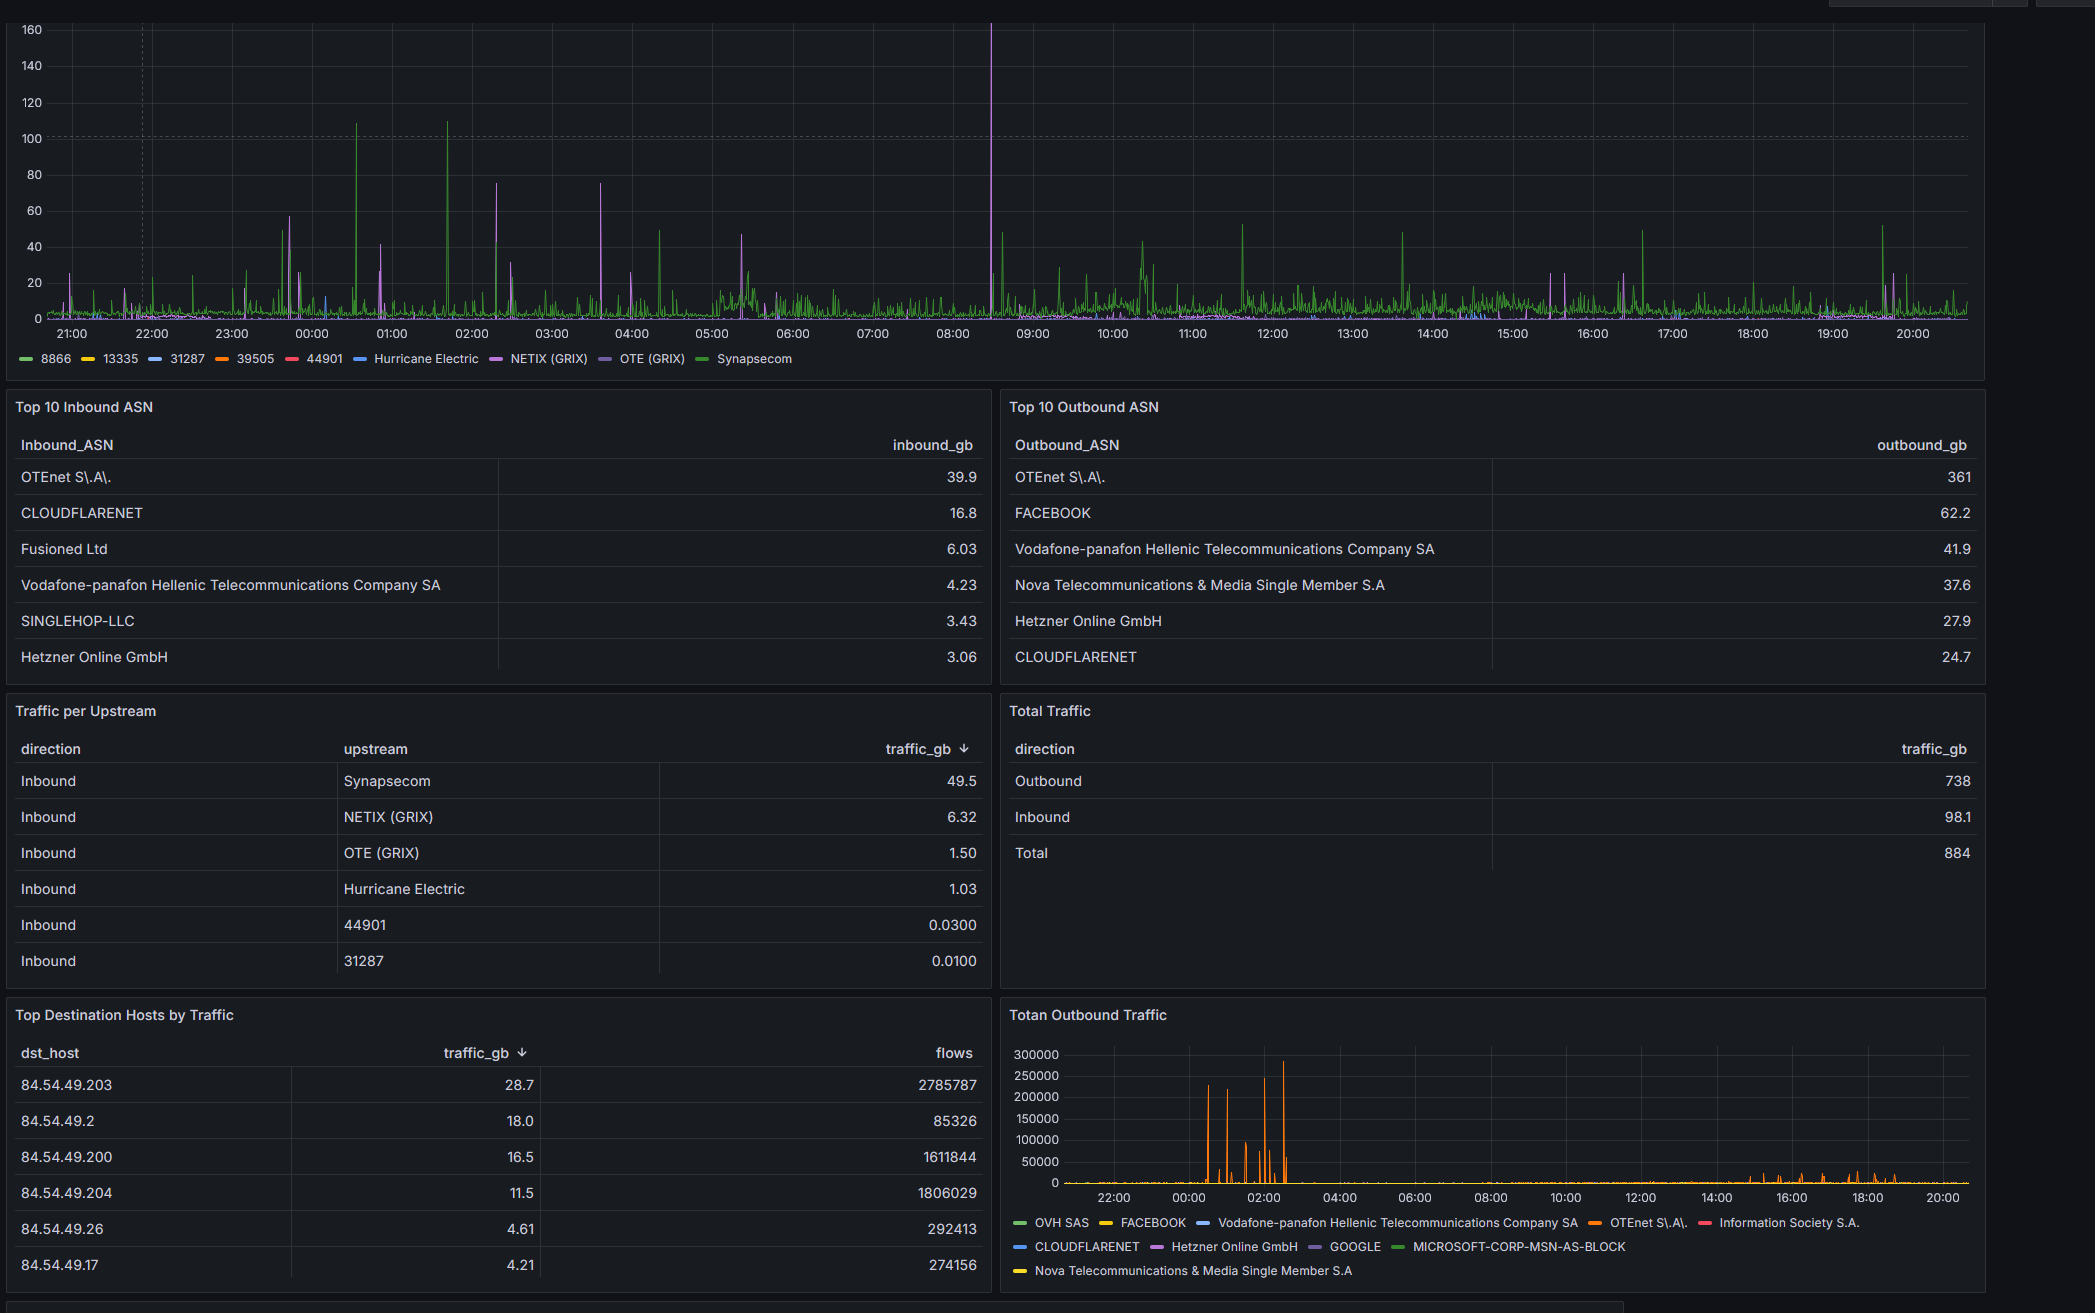
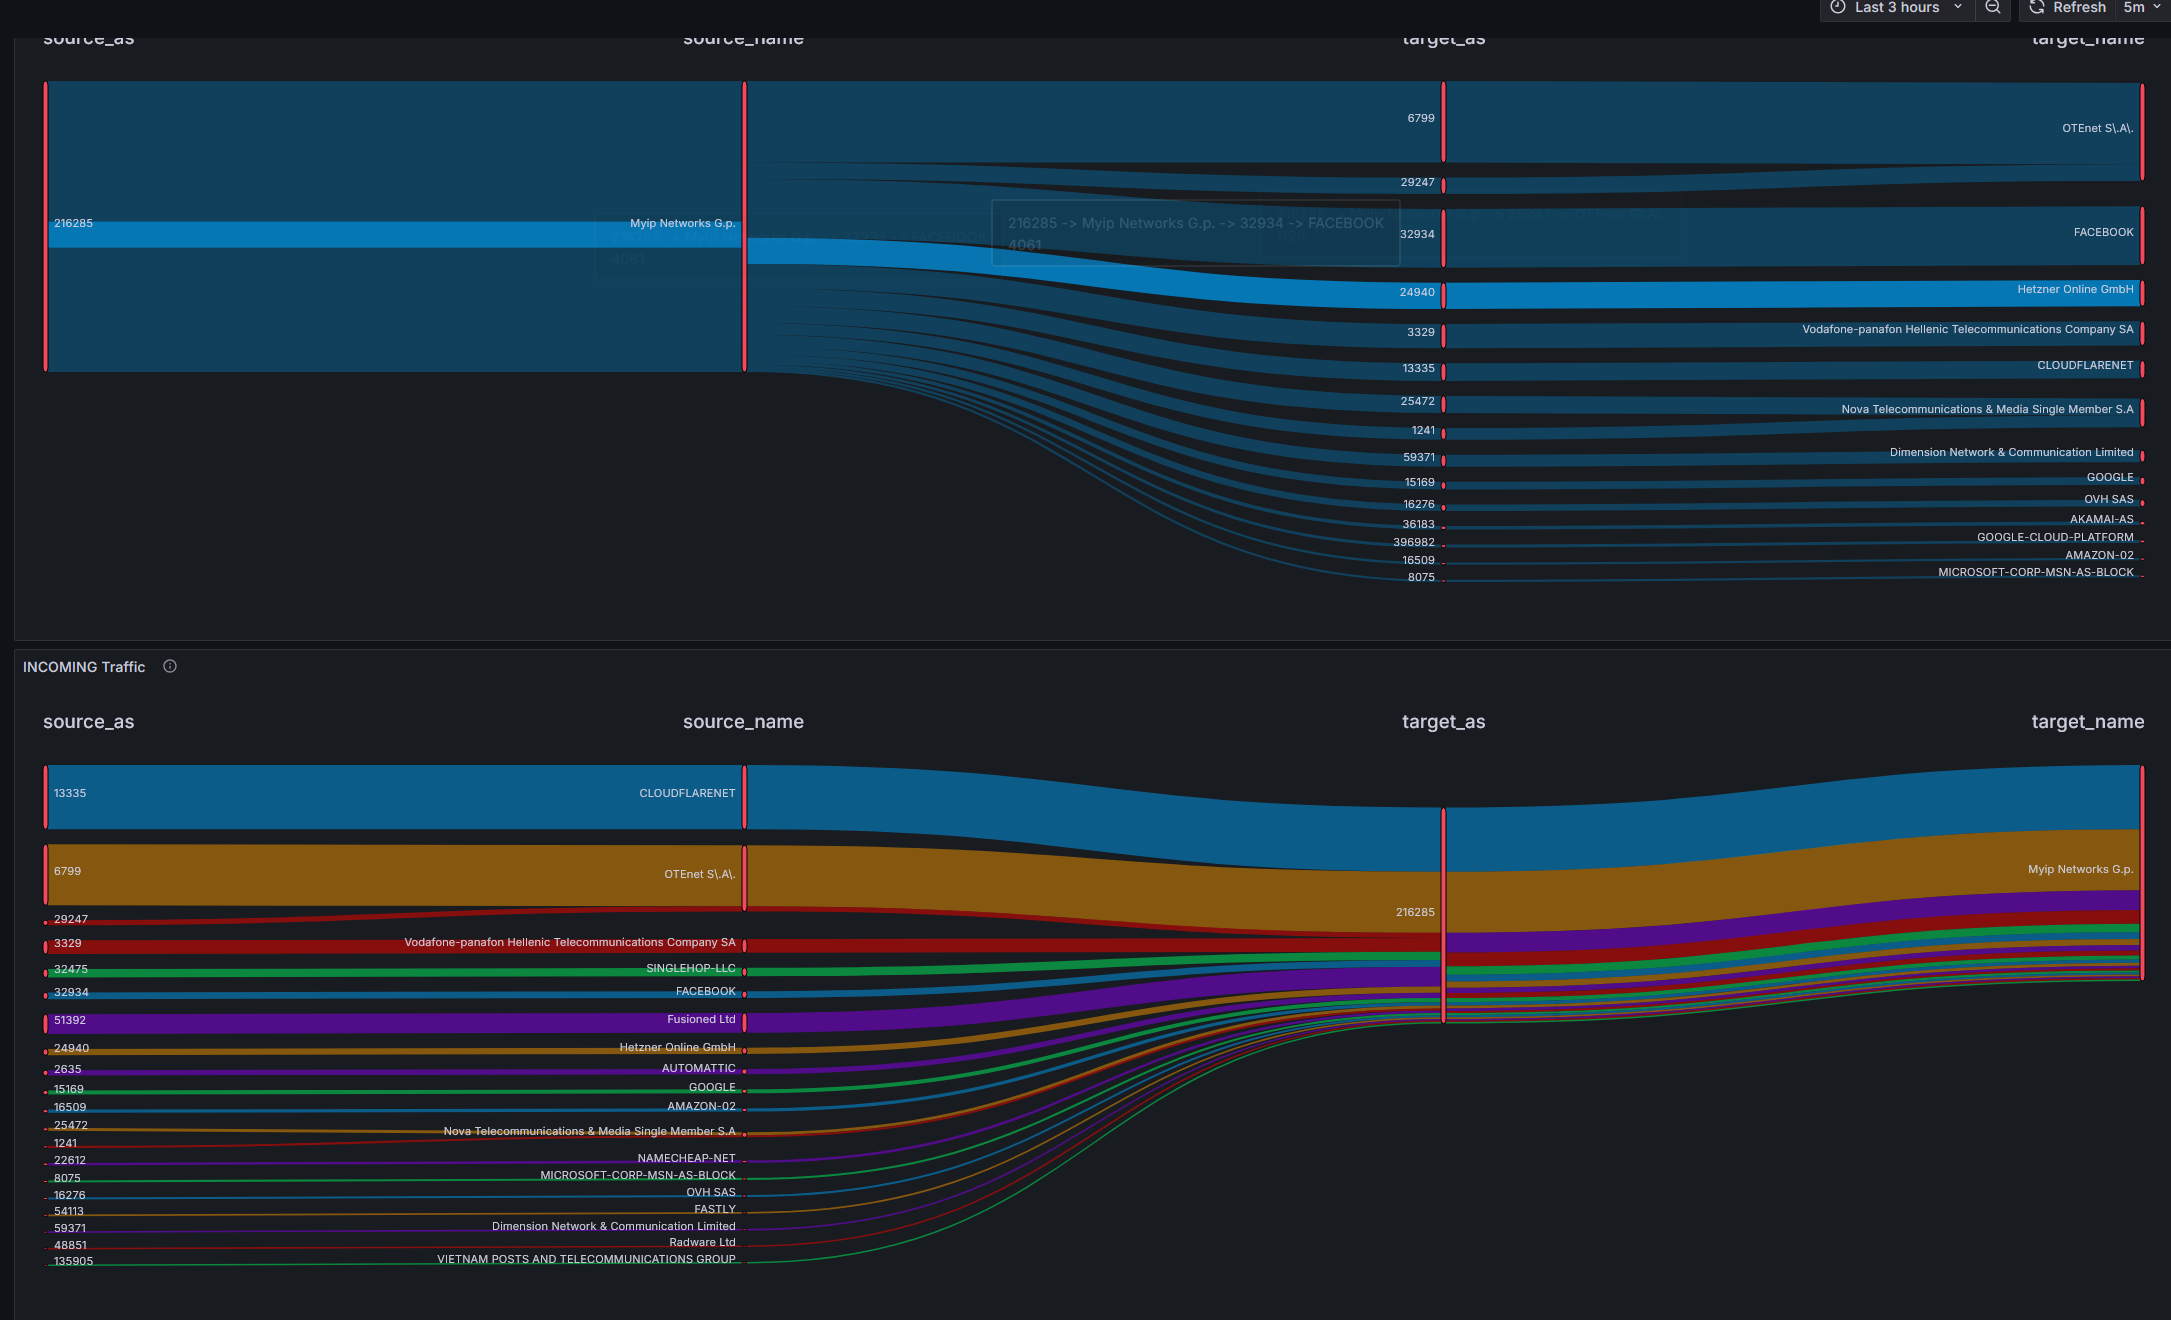
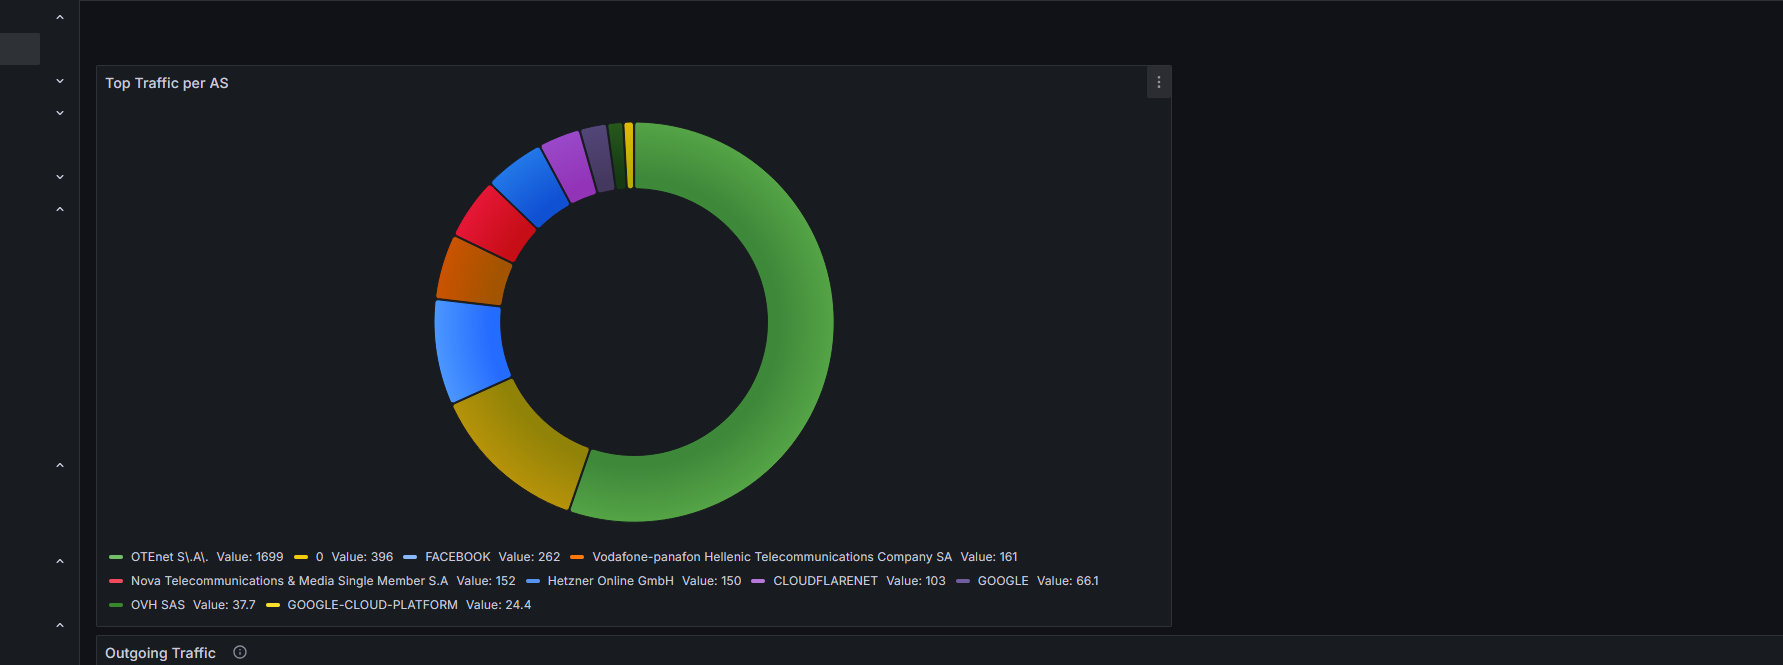
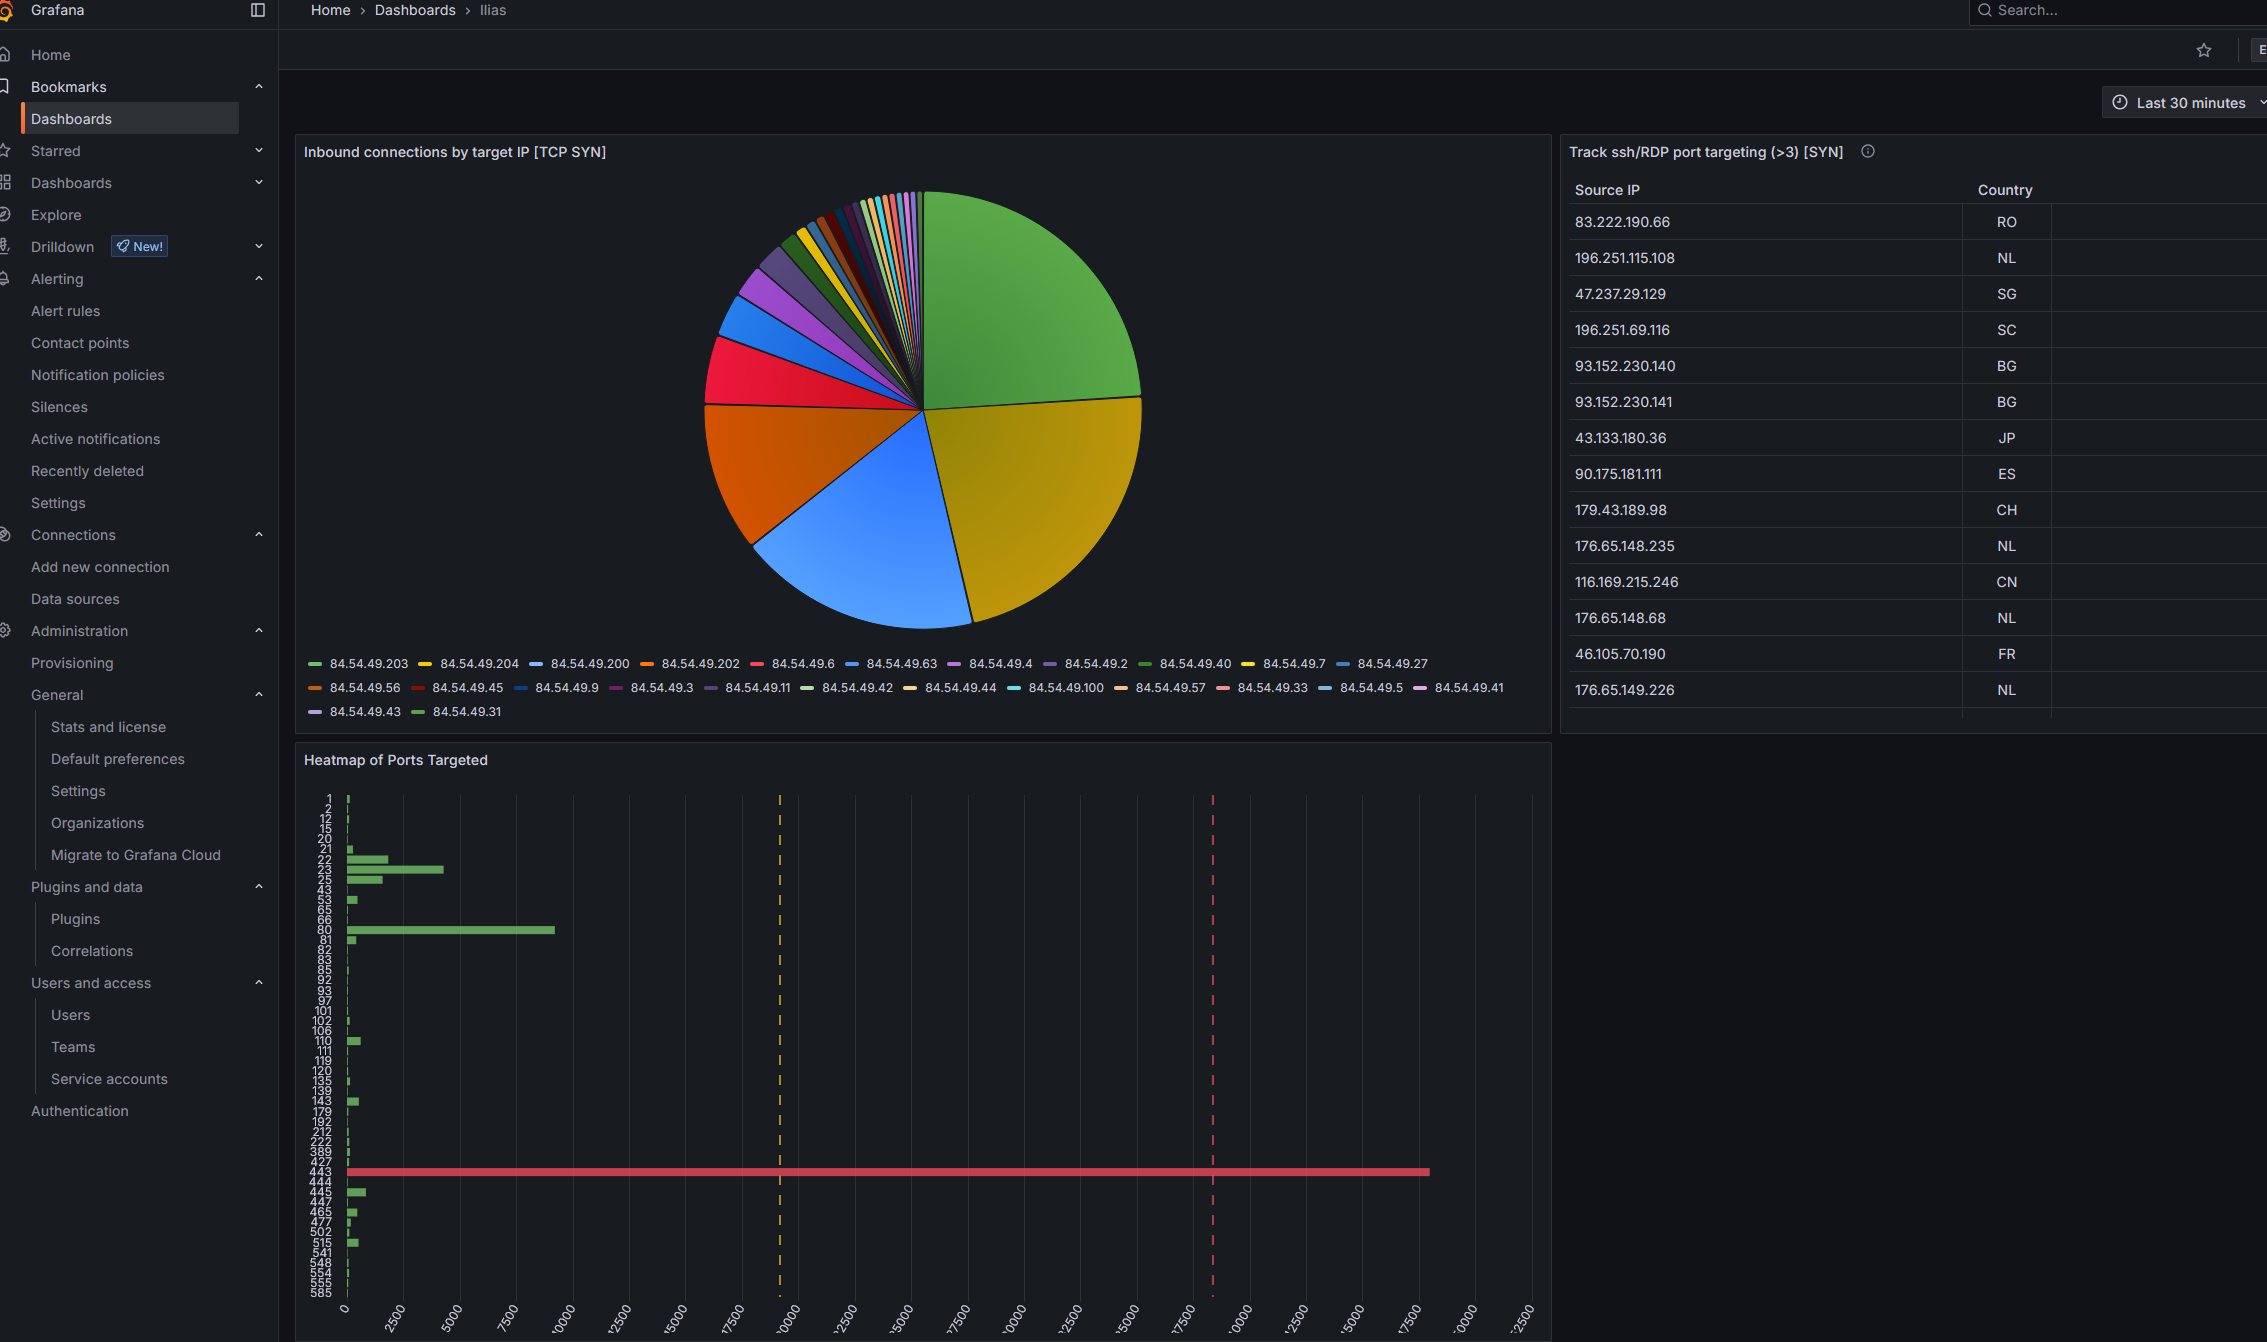
Clickhouse data / queries:
Grafana visualizations:
DEBUGGING TIME!
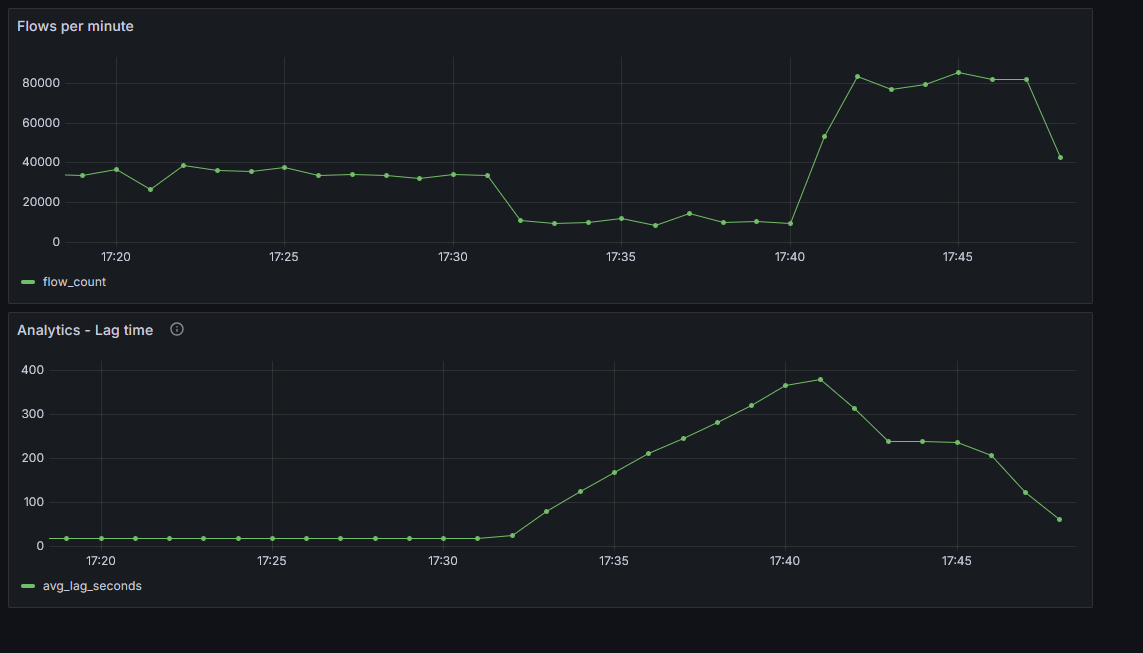
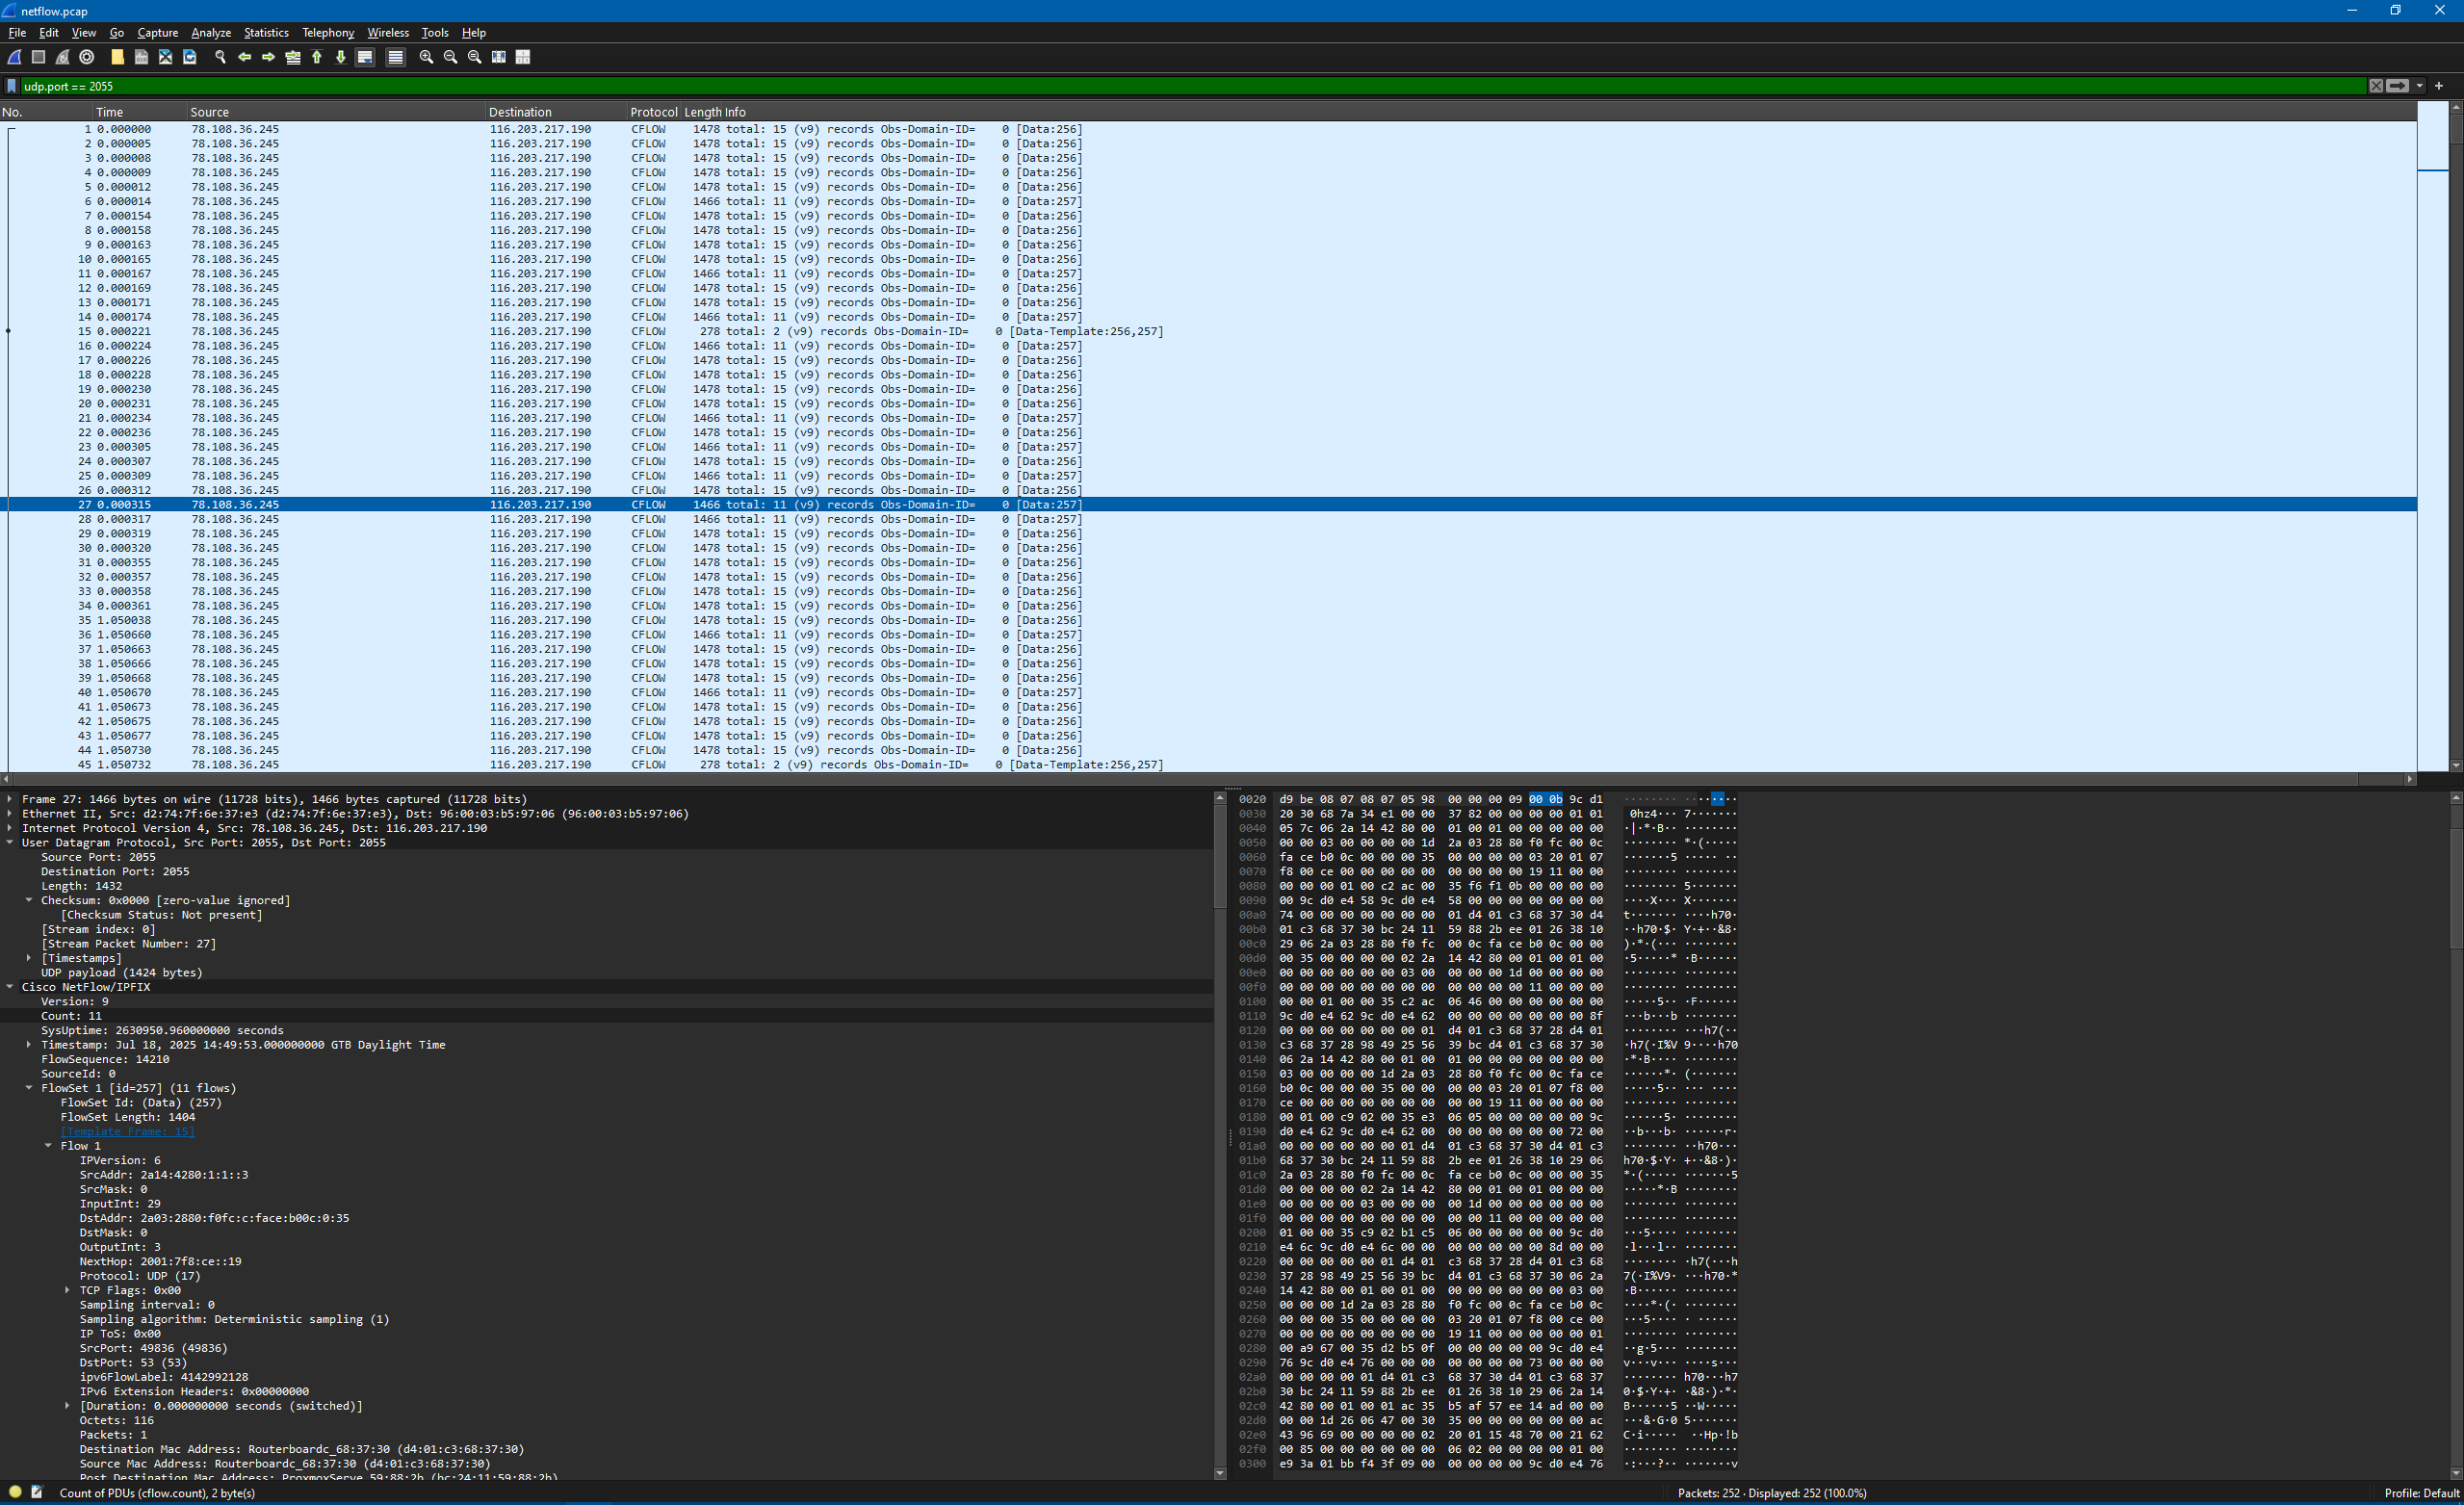
Lag time when testing PTR enrichment:
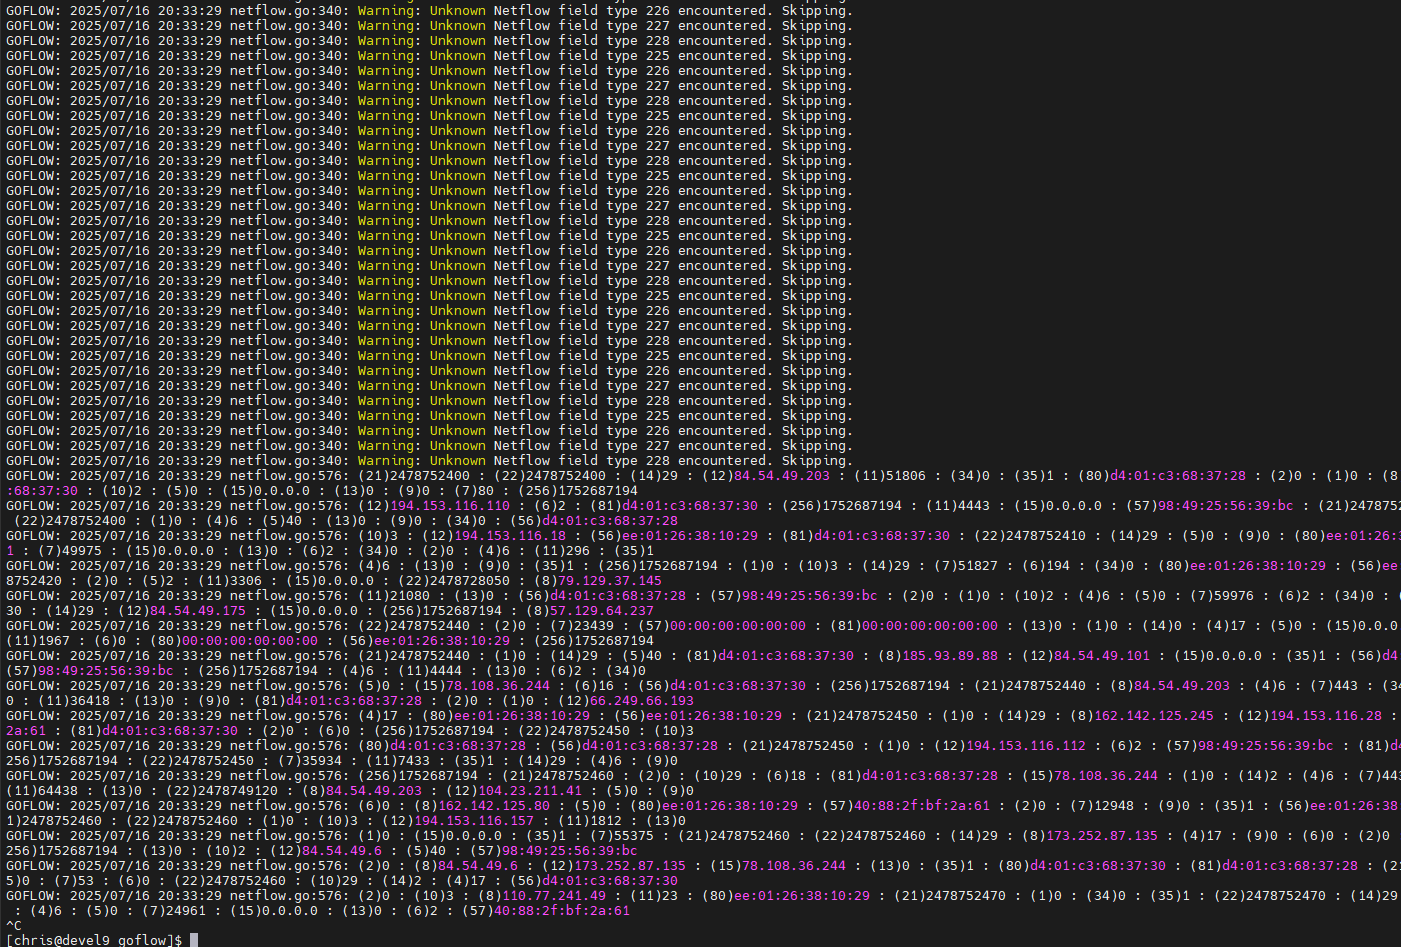
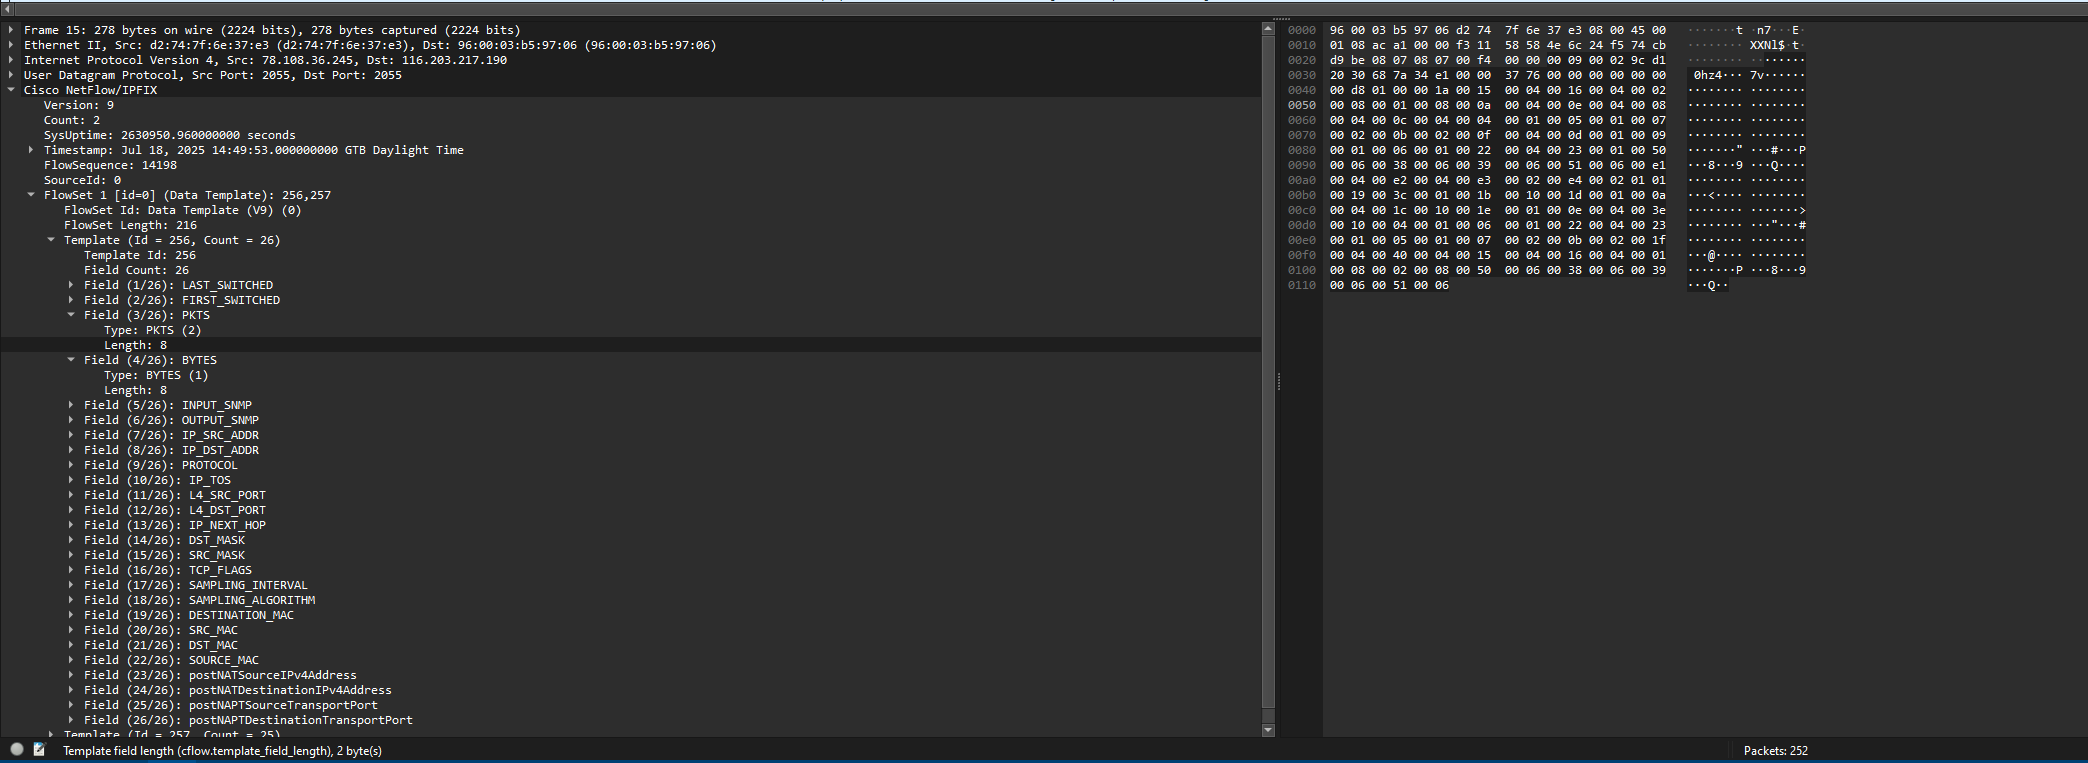
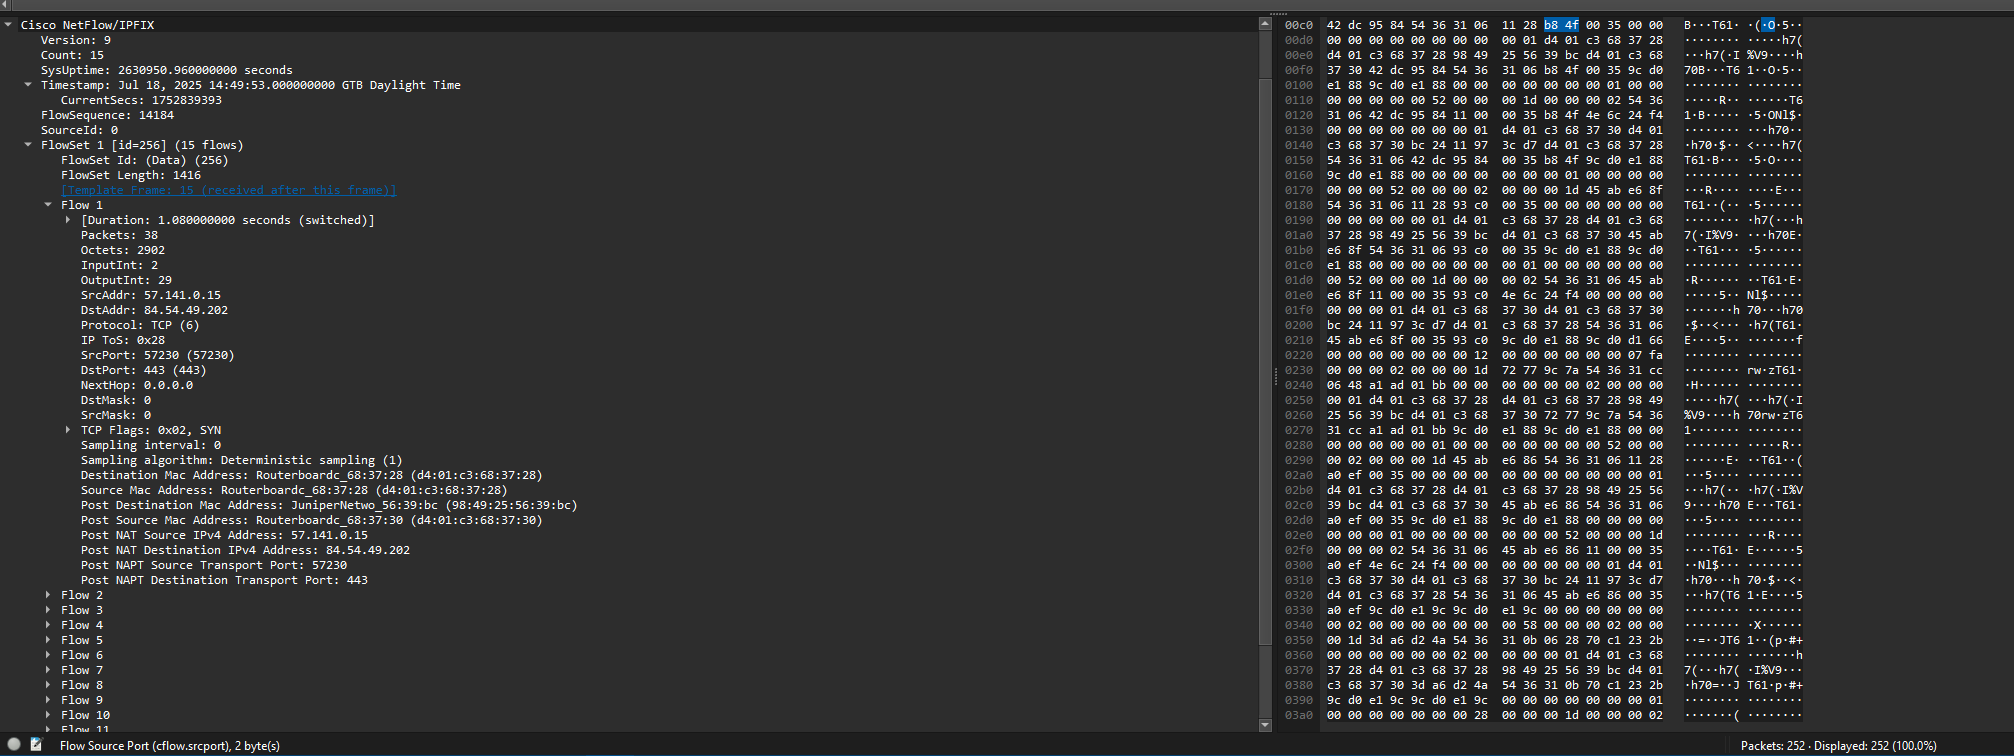
Debugging netflow data and finding fields:
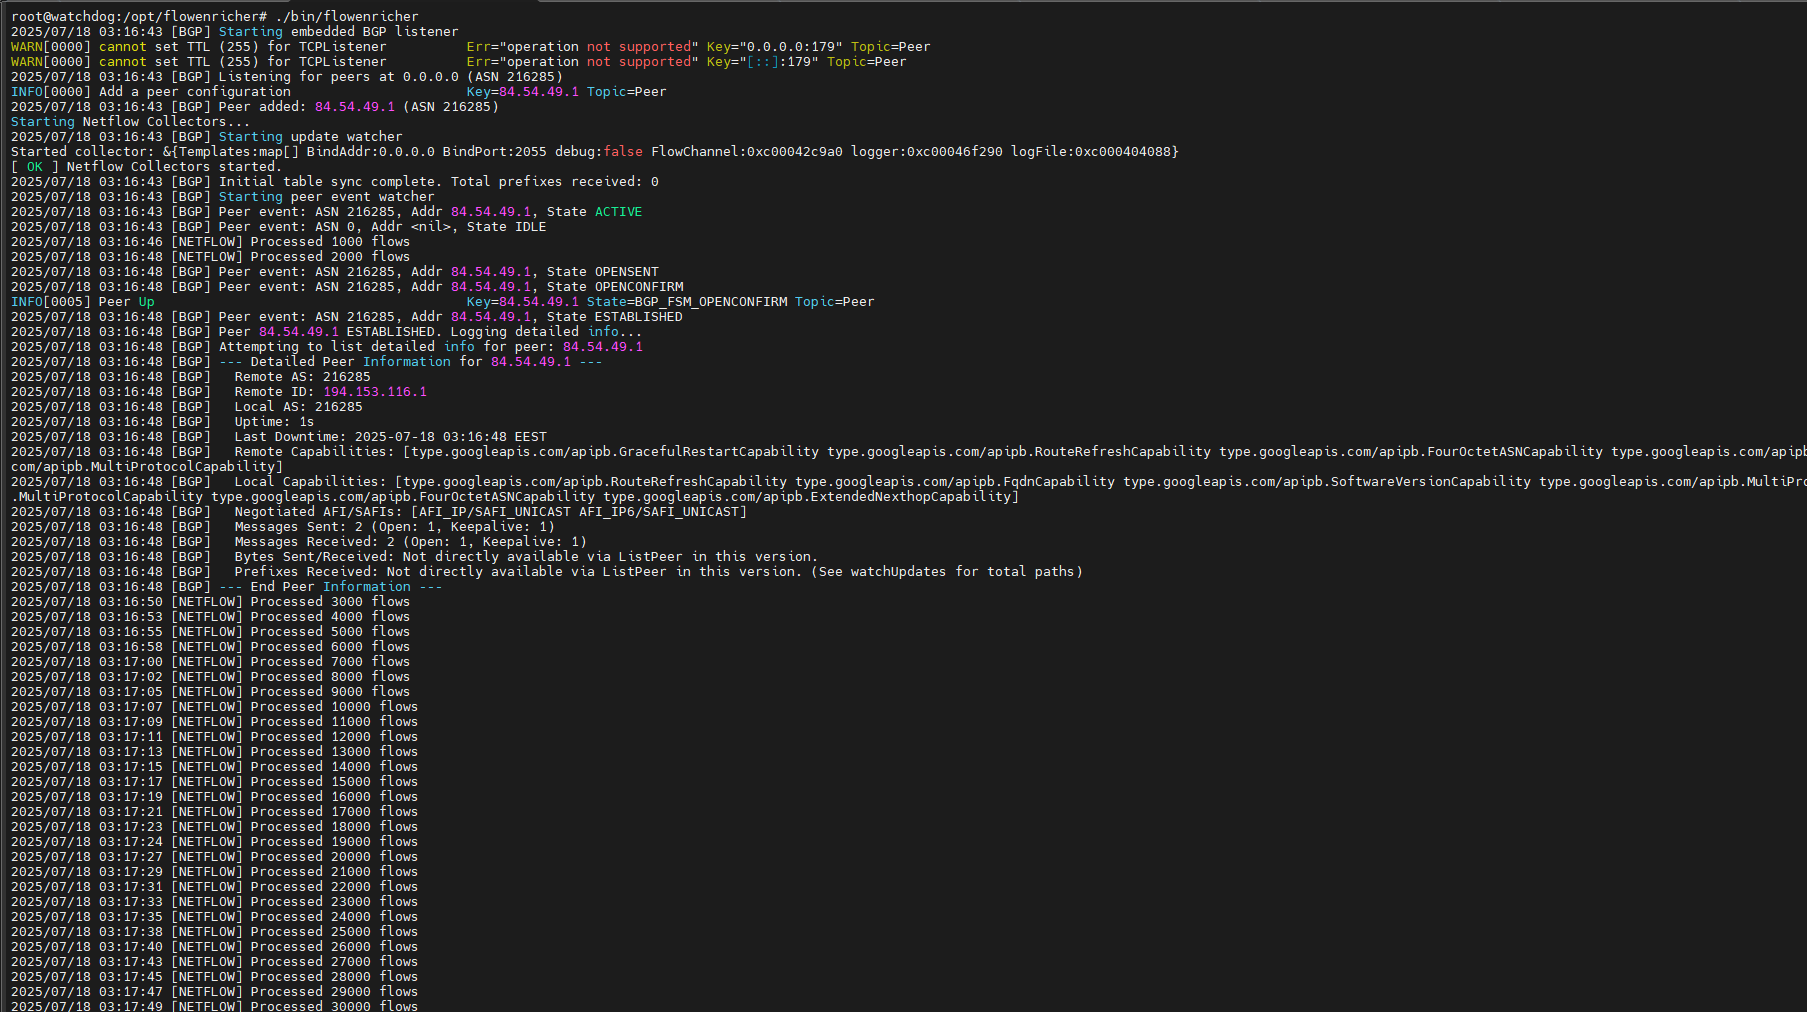
flowenricher startup:
New: Detection and Mitigation Engine
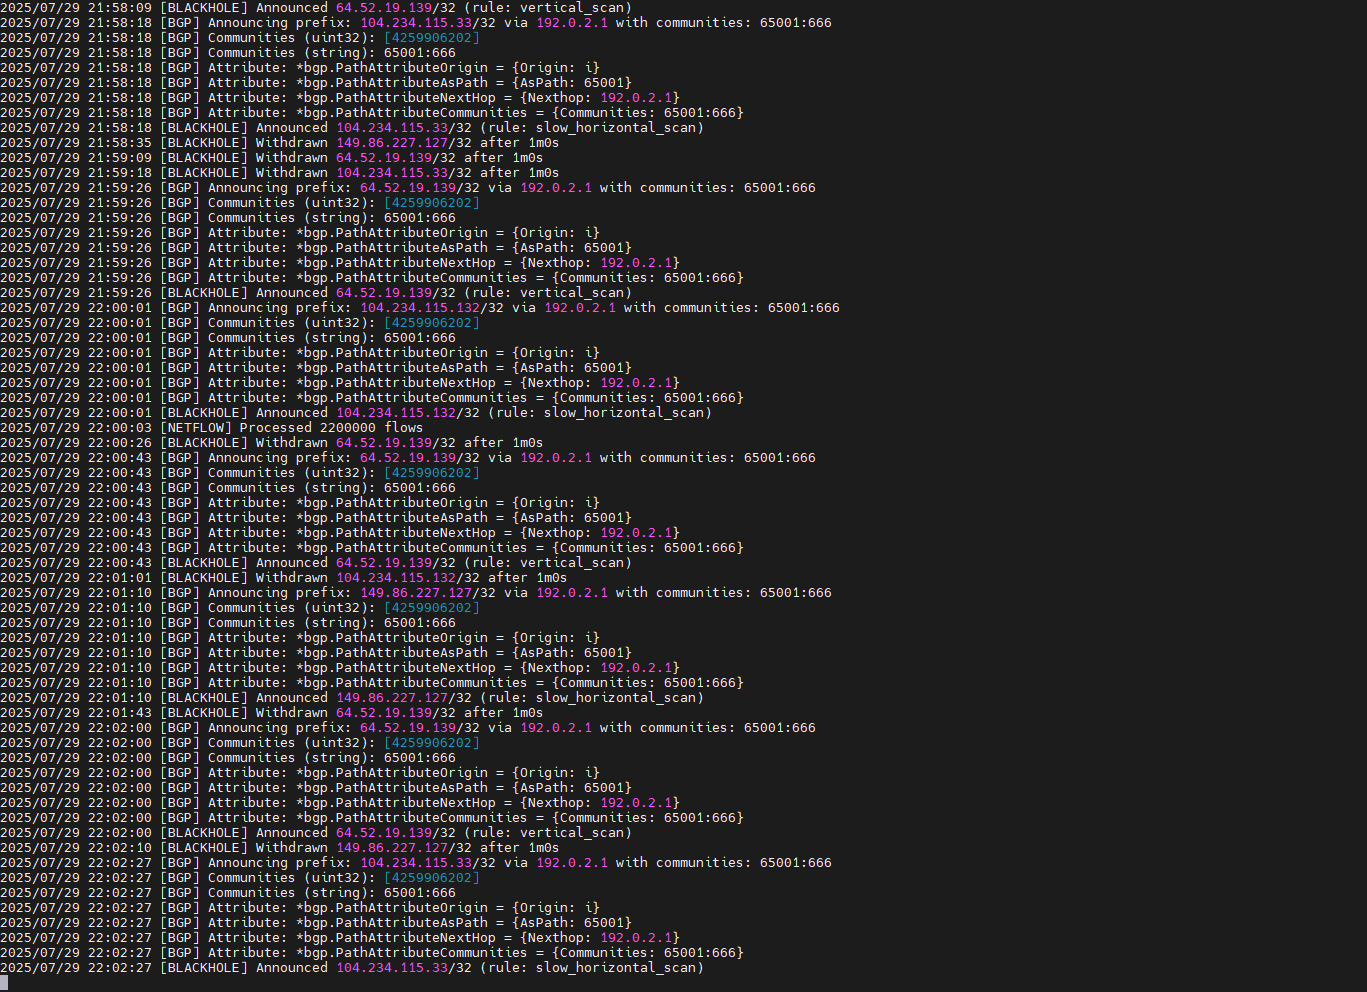
Logs:
Detection config example: