
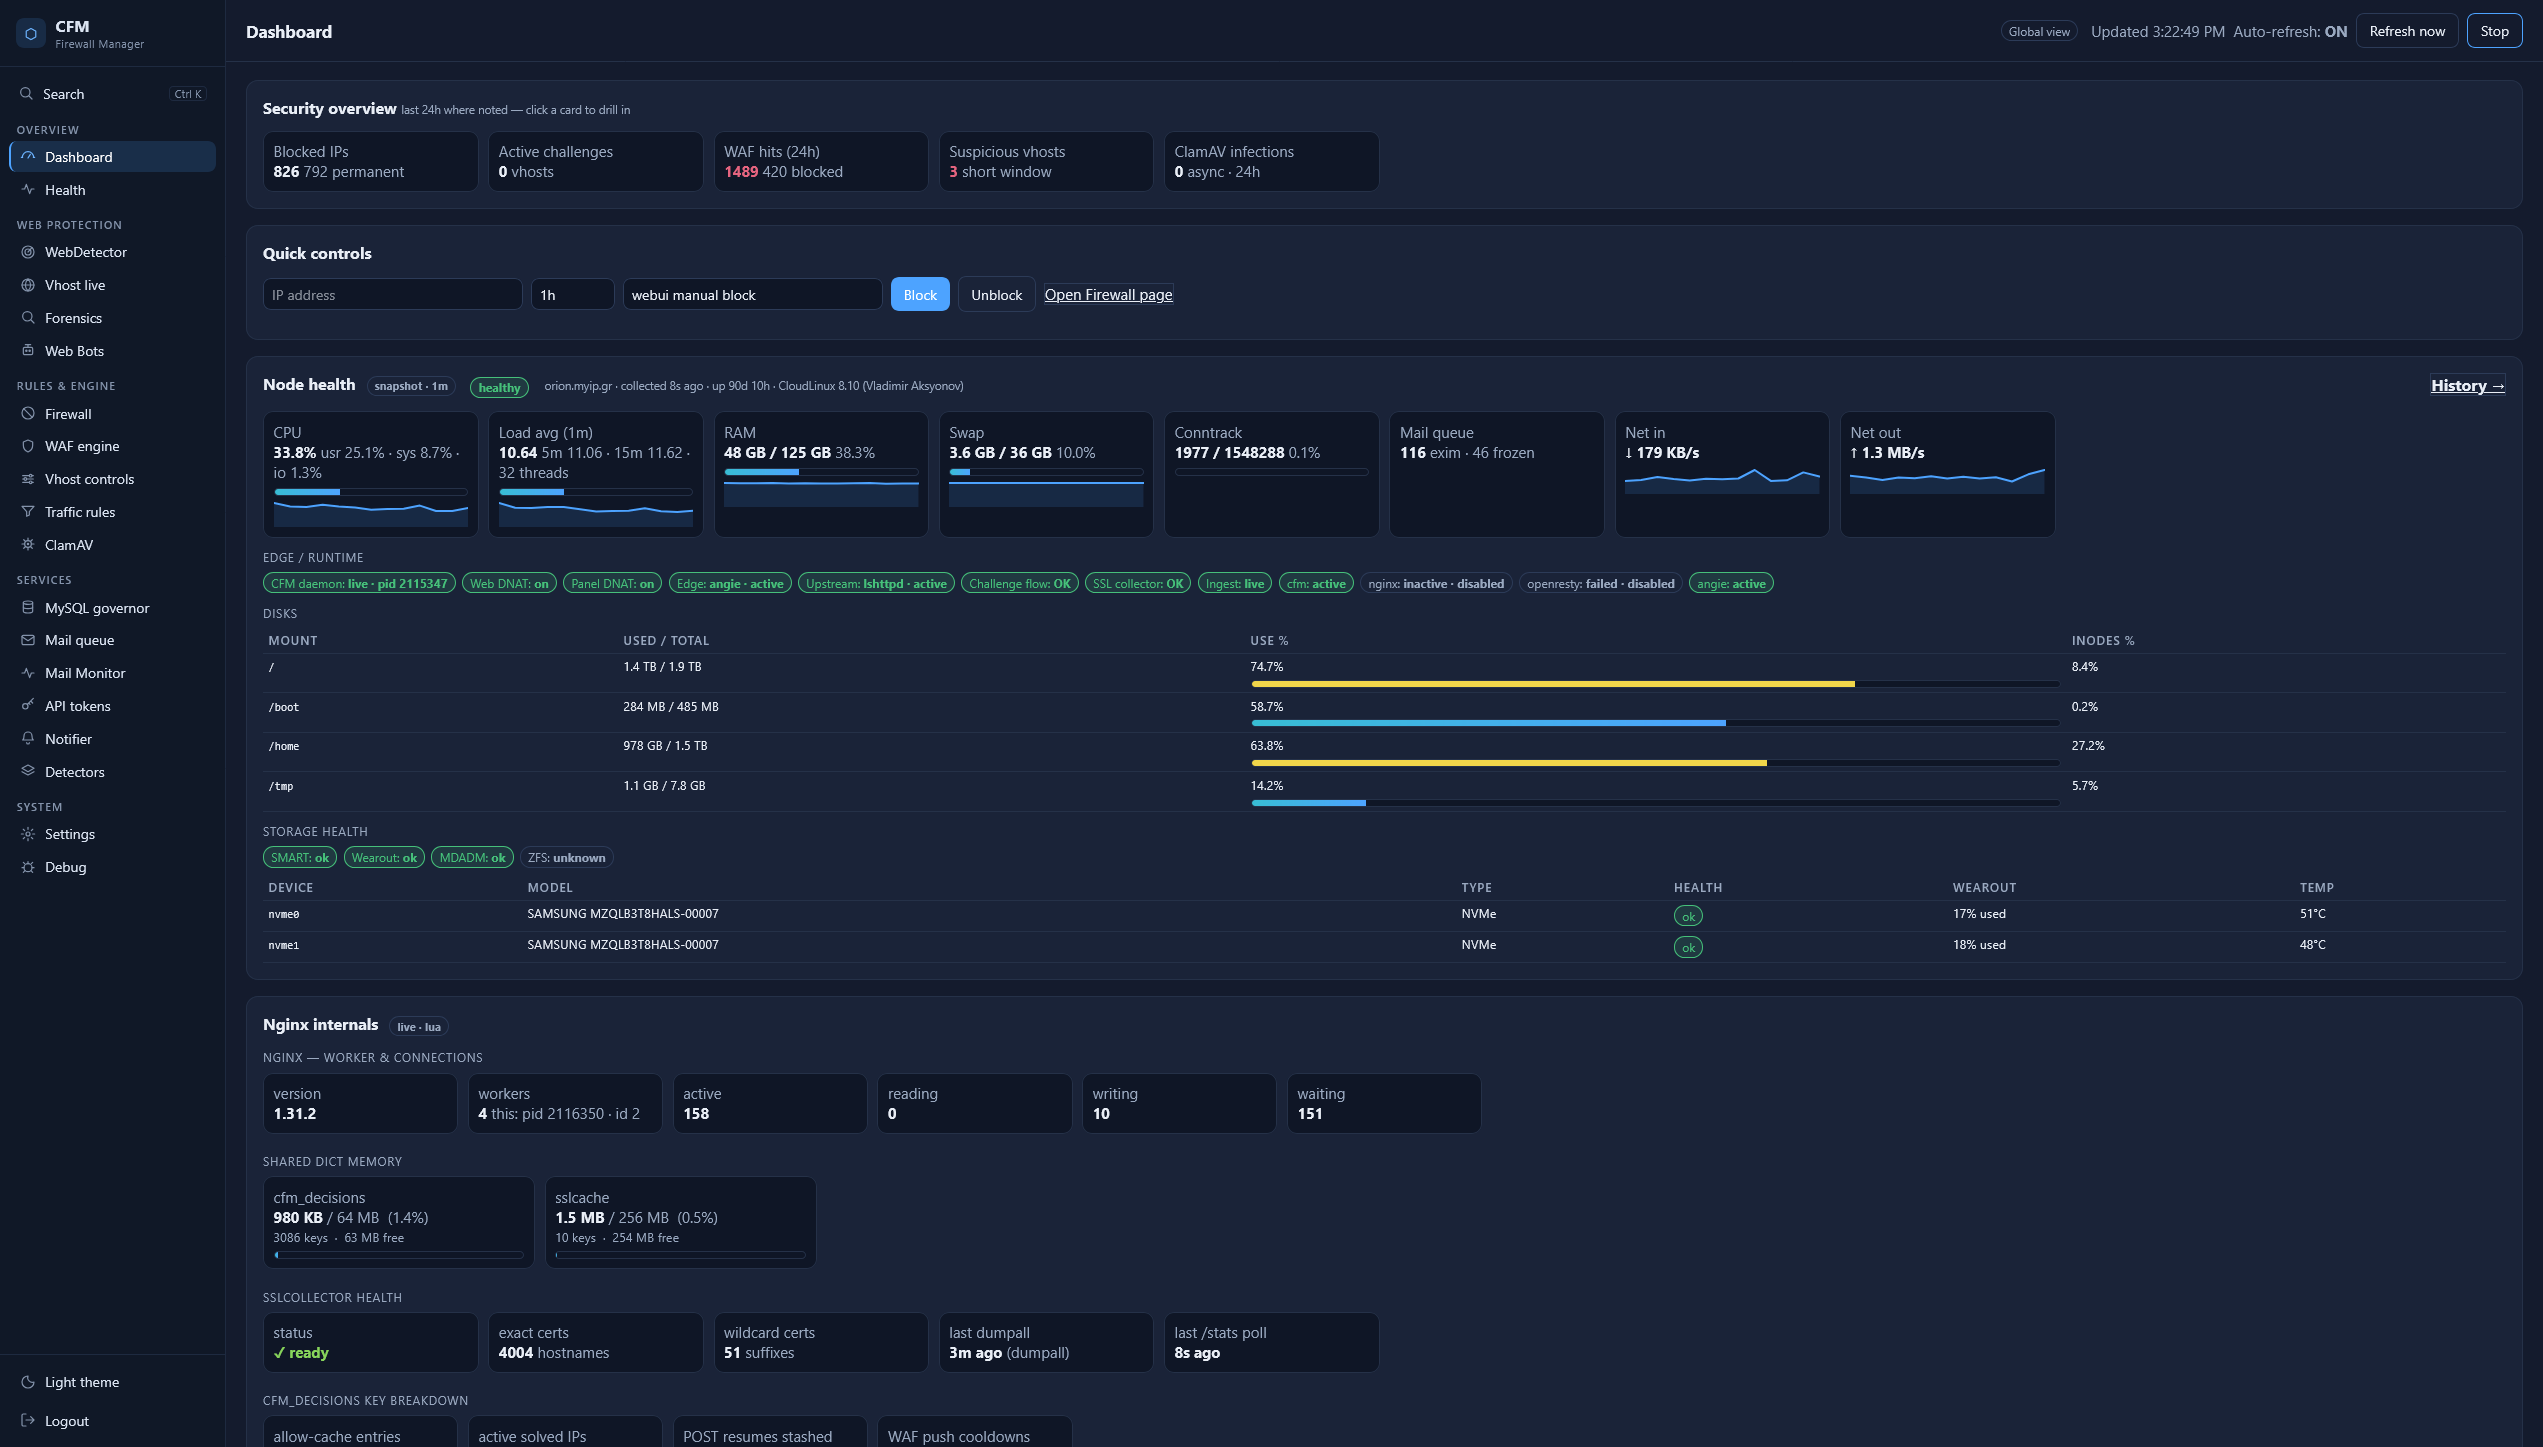
CFM has been CLI-first since day one. This summer it grew a real web UI — and building it turned out to be less about CSS and more about answering a question I’d been avoiding: what is an operator actually trying to do when they open this thing at 3am?
The problem with a CLI-only security daemon
CFM started as an nftables-first firewall manager and grew into a platform: dynamic firewalling, log-driven detection, autoblocking, a challenge engine, an in-path WAF, a ClamAV bridge, kernel attack-surface reduction, a MySQL governor, mail monitoring. Every one of those has a cfm <thing> subcommand, an API endpoint, and (more recently) an MCP tool.
That’s fine when the operator is the person who wrote it. It stops being fine the moment you want anyone else to use it — or the moment you need to answer a question that spans three subsystems at once.
Here’s a real one. A customer emails: “my site is slow and my visitors get a ‘Checking your browser’ page.” To answer that from the CLI you need the vhost’s short-window score, whether a challenge is armed and why, whether the WAF fired on that host, which IPs are hitting it and from where, and whether the box itself is under load. That’s five commands, three of which you have to remember the flags for, and you’re mentally joining the output.
The UI’s job is that join.
The design problem: monitoring and investigation are not the same job
The first version of the WebDetector page tried to be everything: live traffic, suspicious hosts, forensics history, bot stats, per-vhost rules, scoped API tokens. It was a wall. It also auto-refreshed every five seconds, which meant the moment you started reading something, it moved.
That’s the actual insight, and everything else follows from it:
Live monitoring wants to move. Investigation wants to hold still.
A monitoring surface is a glance: it should refresh, show the last N seconds, and answer “is anything wrong right now?” An investigation surface is a session: you land on it with a specific IP or vhost in mind, you filter, you scroll, you follow a link, and the last thing you want is the table re-sorting under your cursor.
So the WebDetector became four pages that share one data layer:
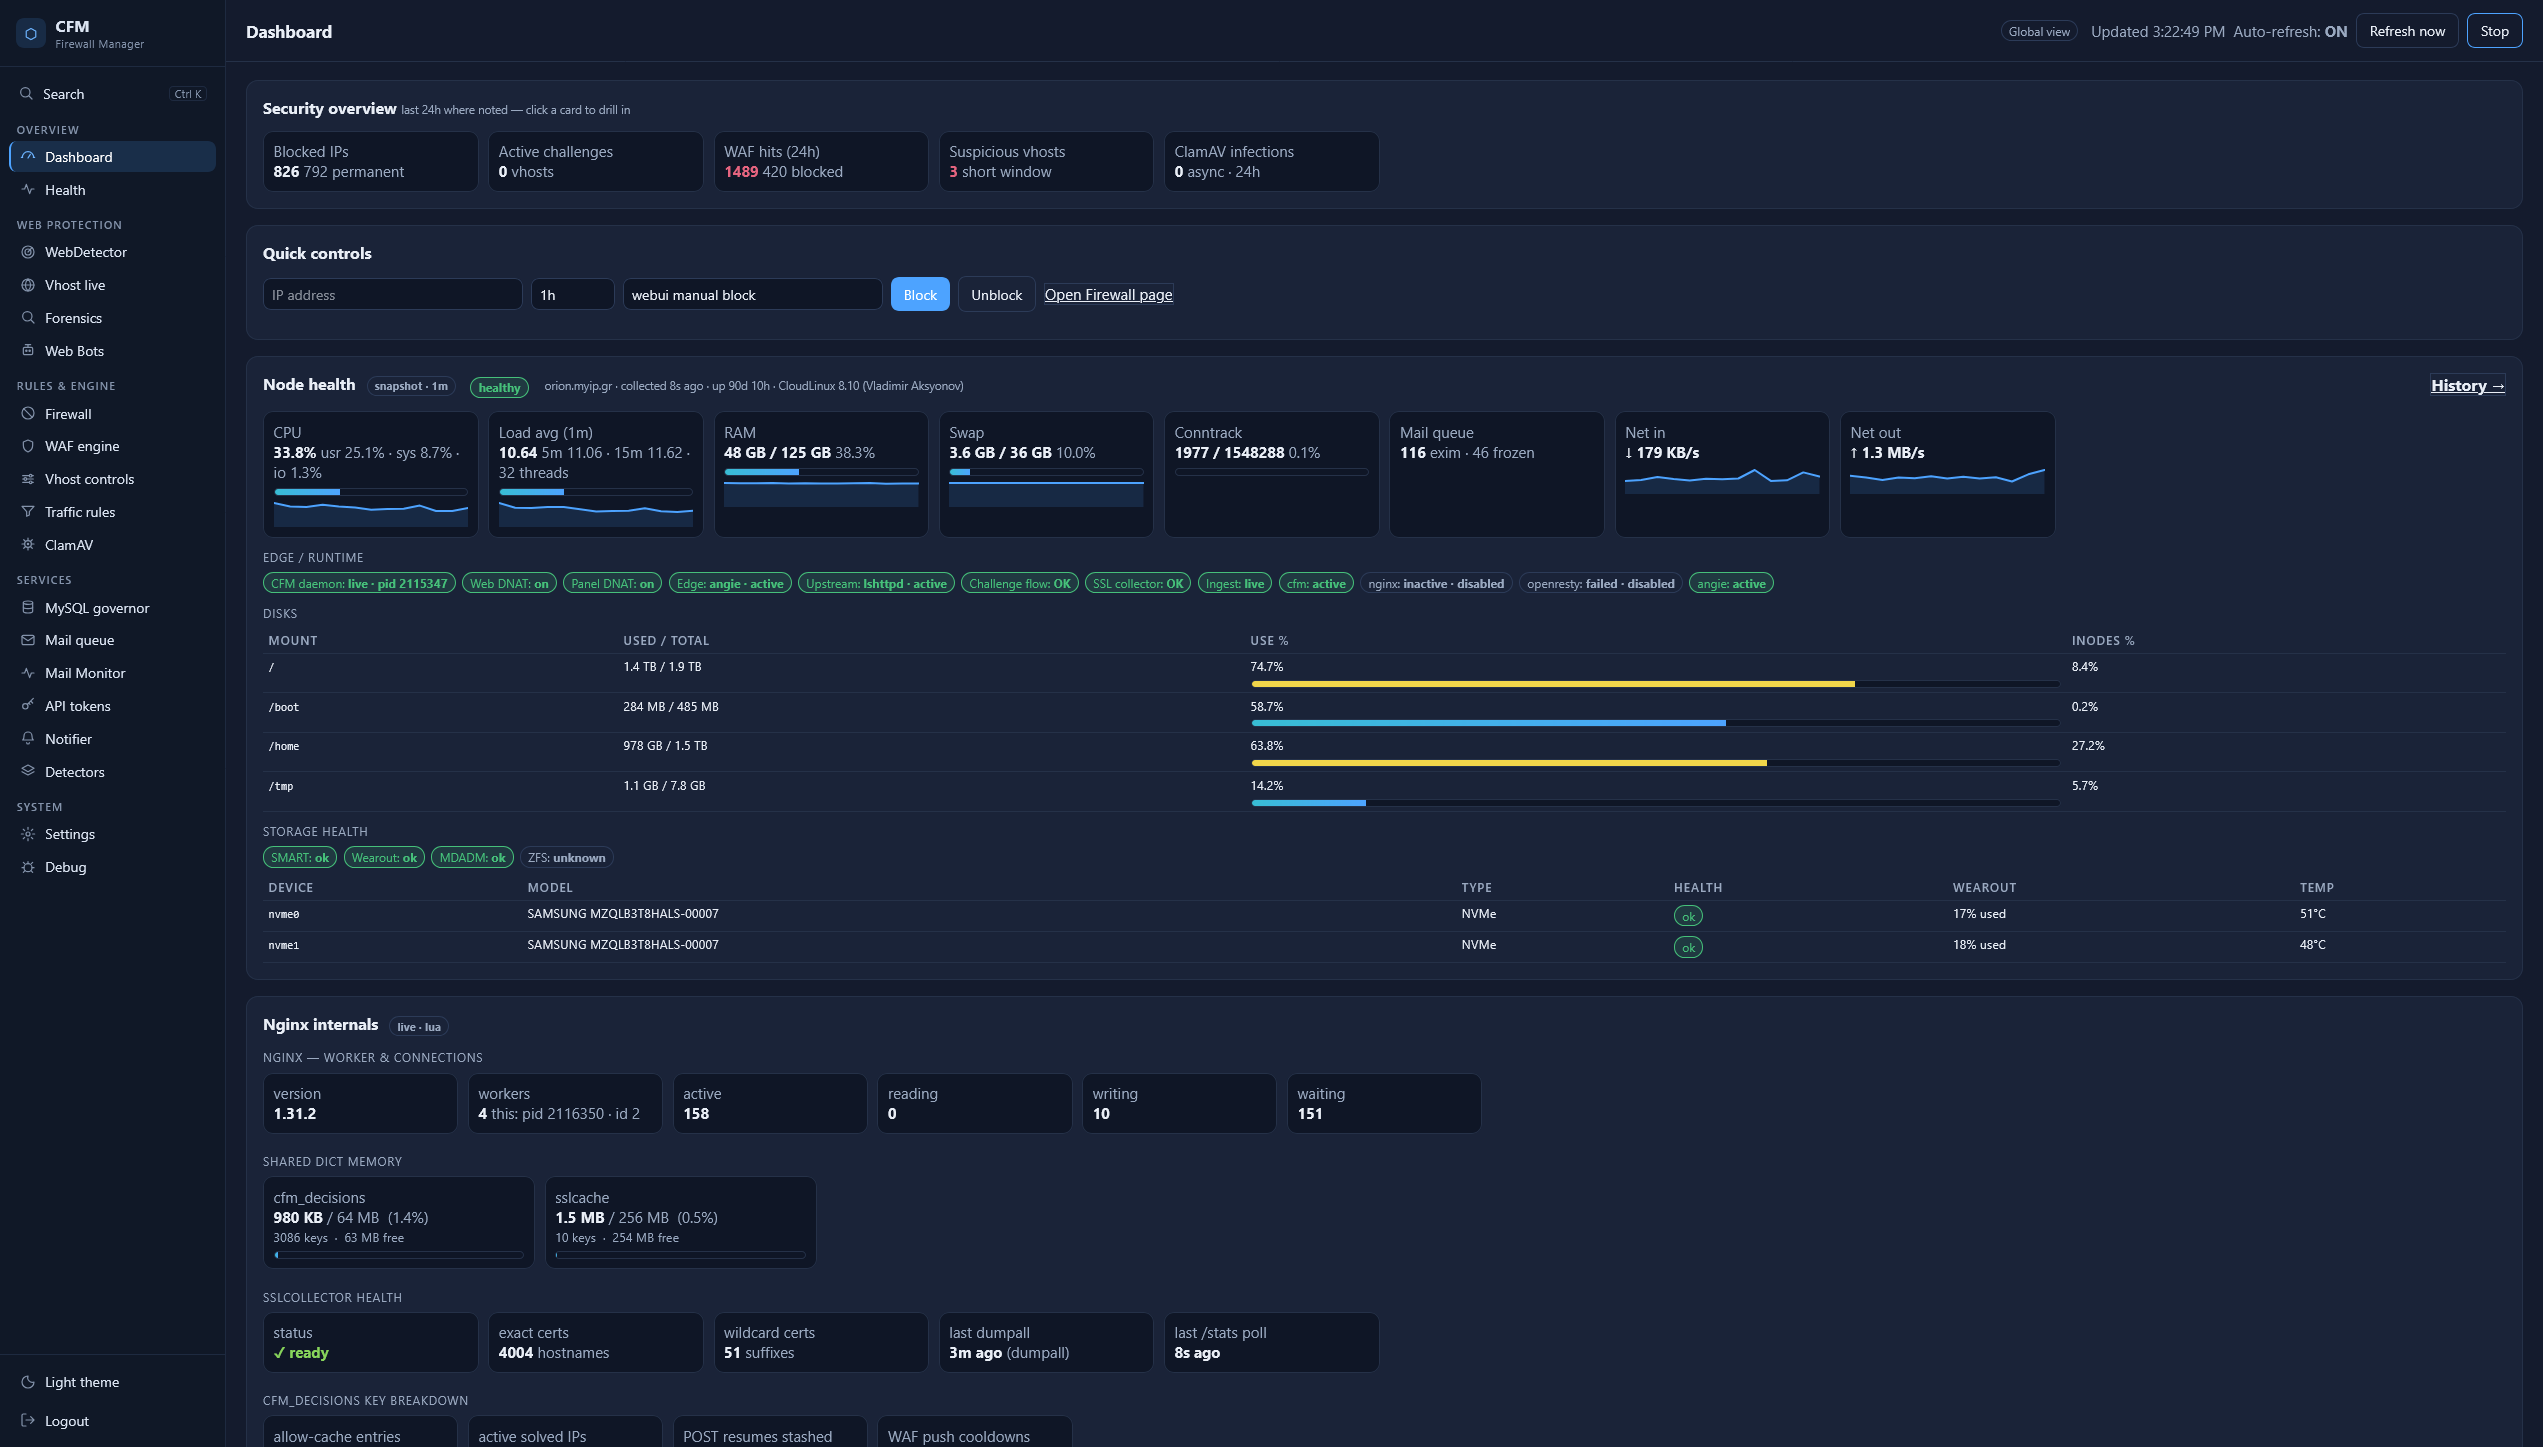
- WebDetector / overview — the short-window WebTop, global top IPs, and suspicious + challenged vhosts. Auto-refresh on, interval configurable.
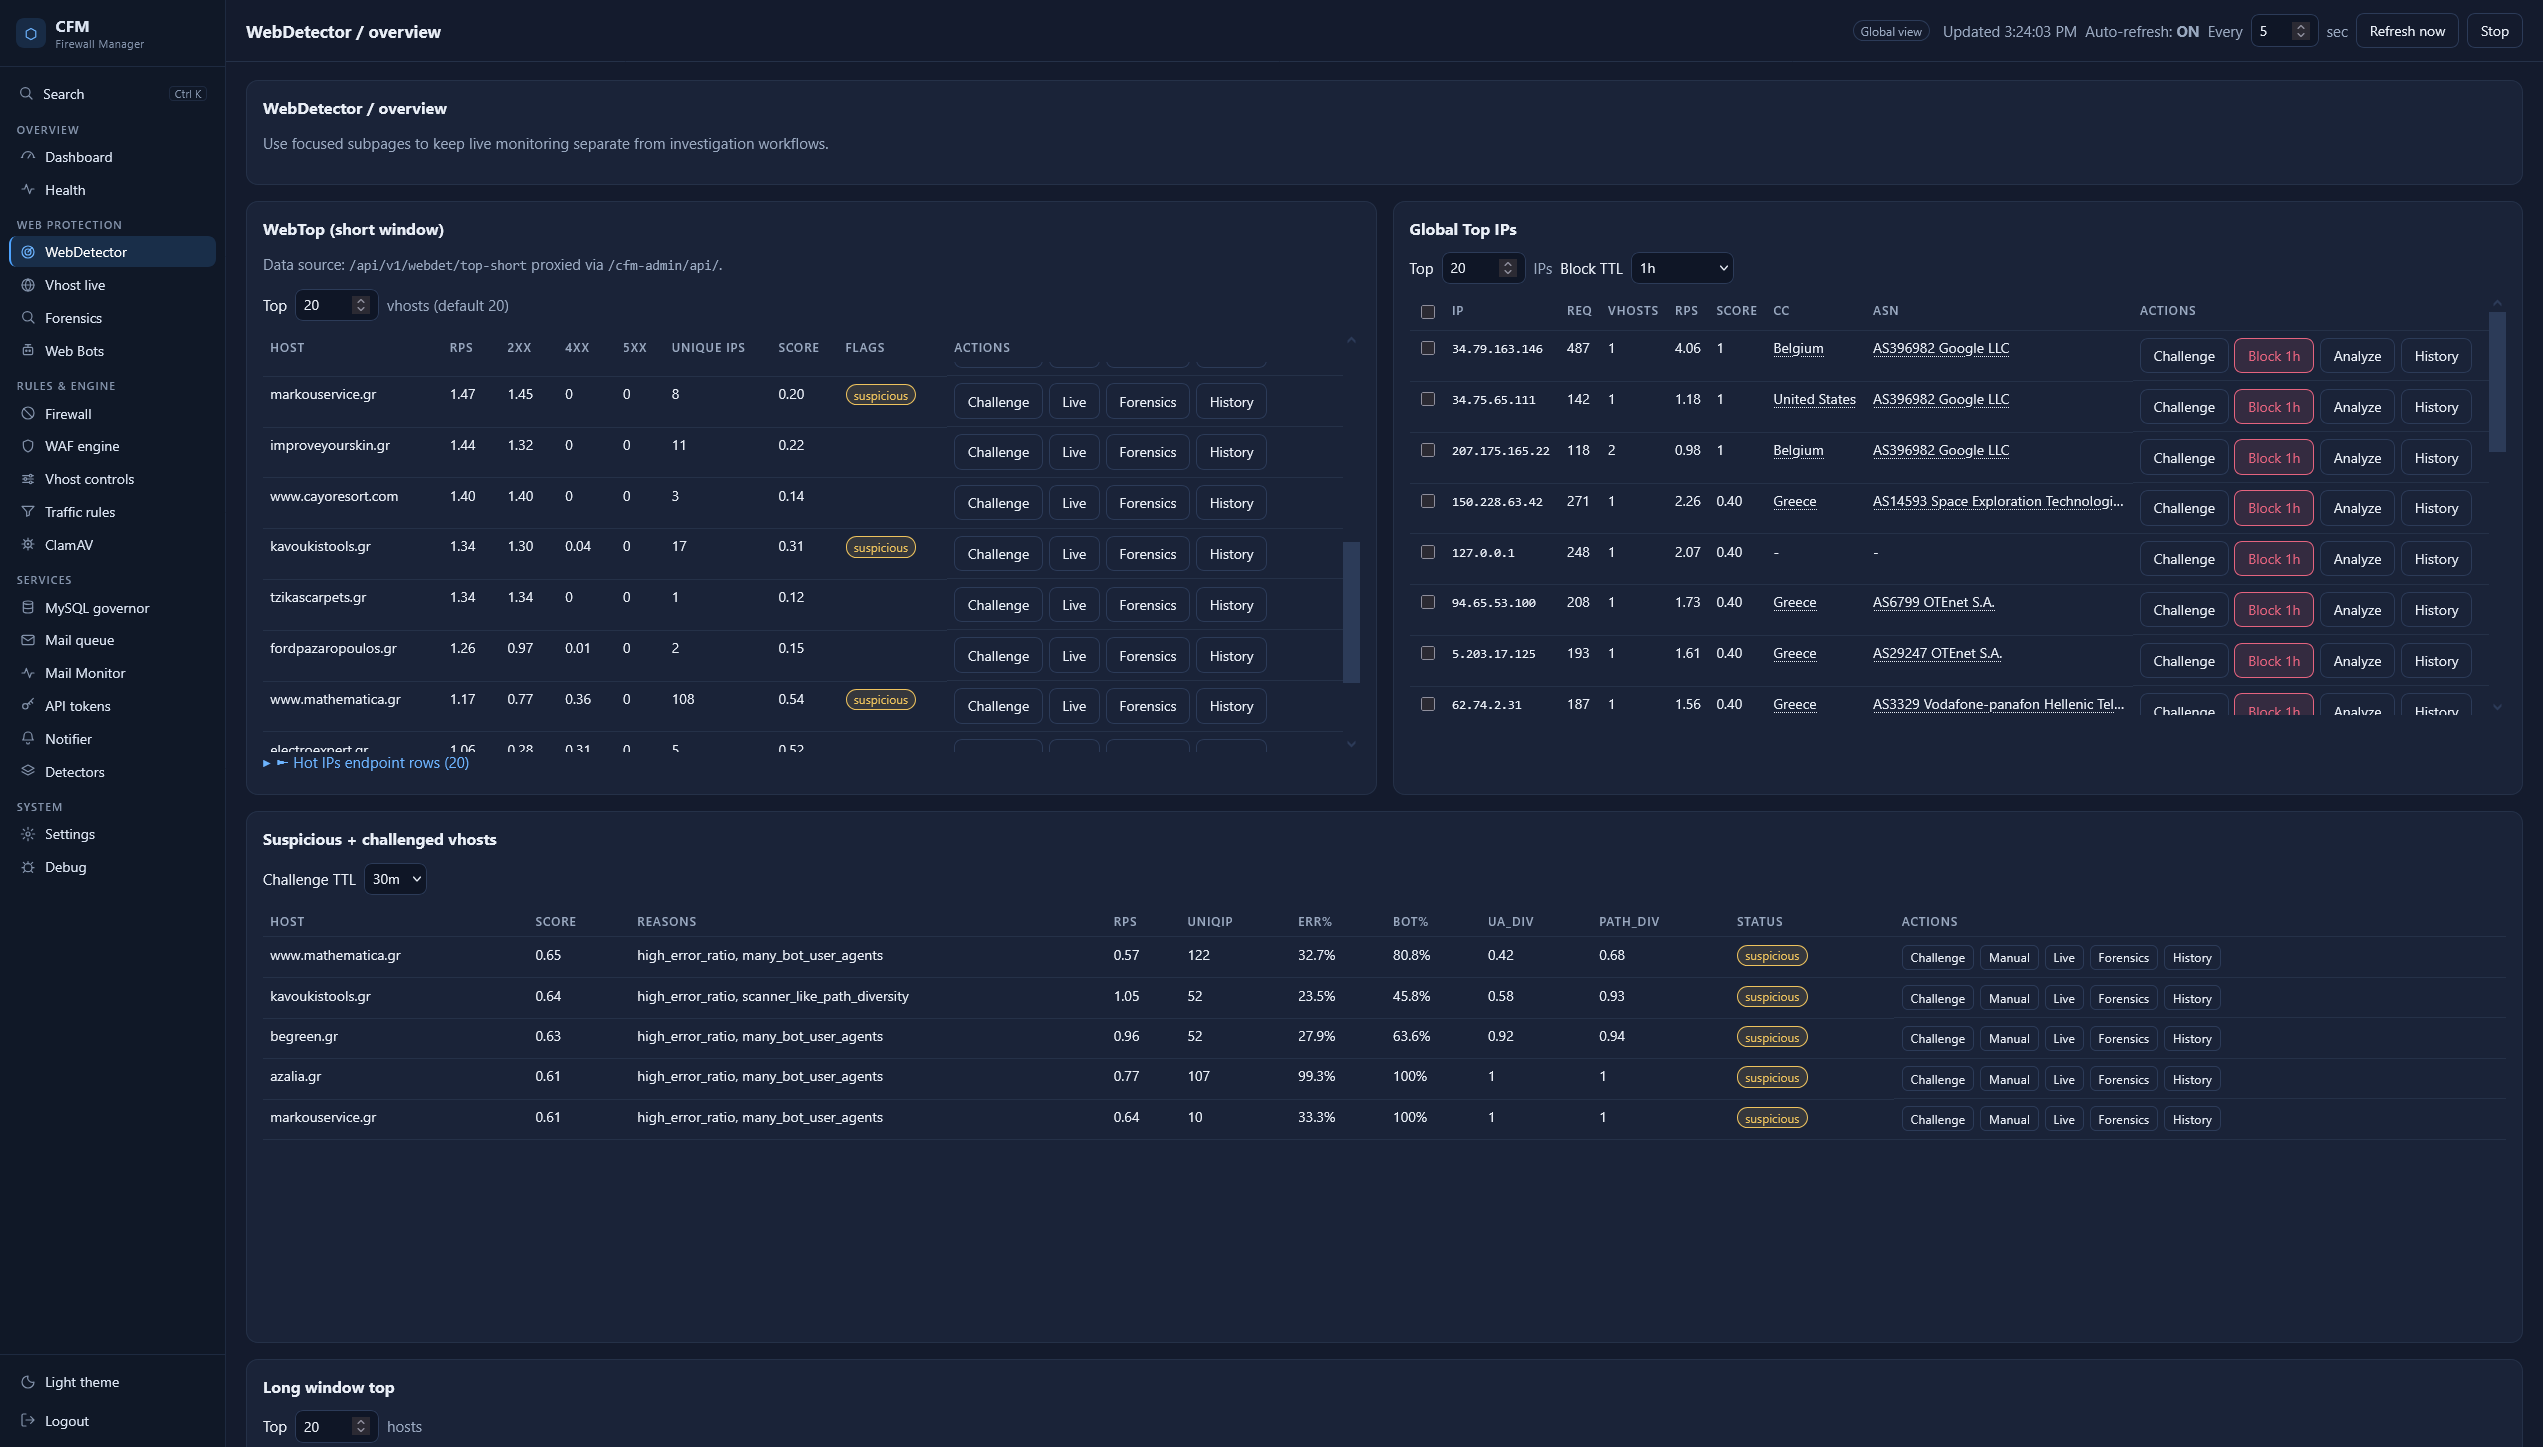
- Vhost live — one host, in real time.
- Forensics — the persisted history table, with filters (host, IP, event type, “impossible UA only”), a retention/prune control, and the dynamic challenge/WAF excludes underneath. Auto-refresh off by default.
- Web Bots — user-agent view with per-UA drilldown.
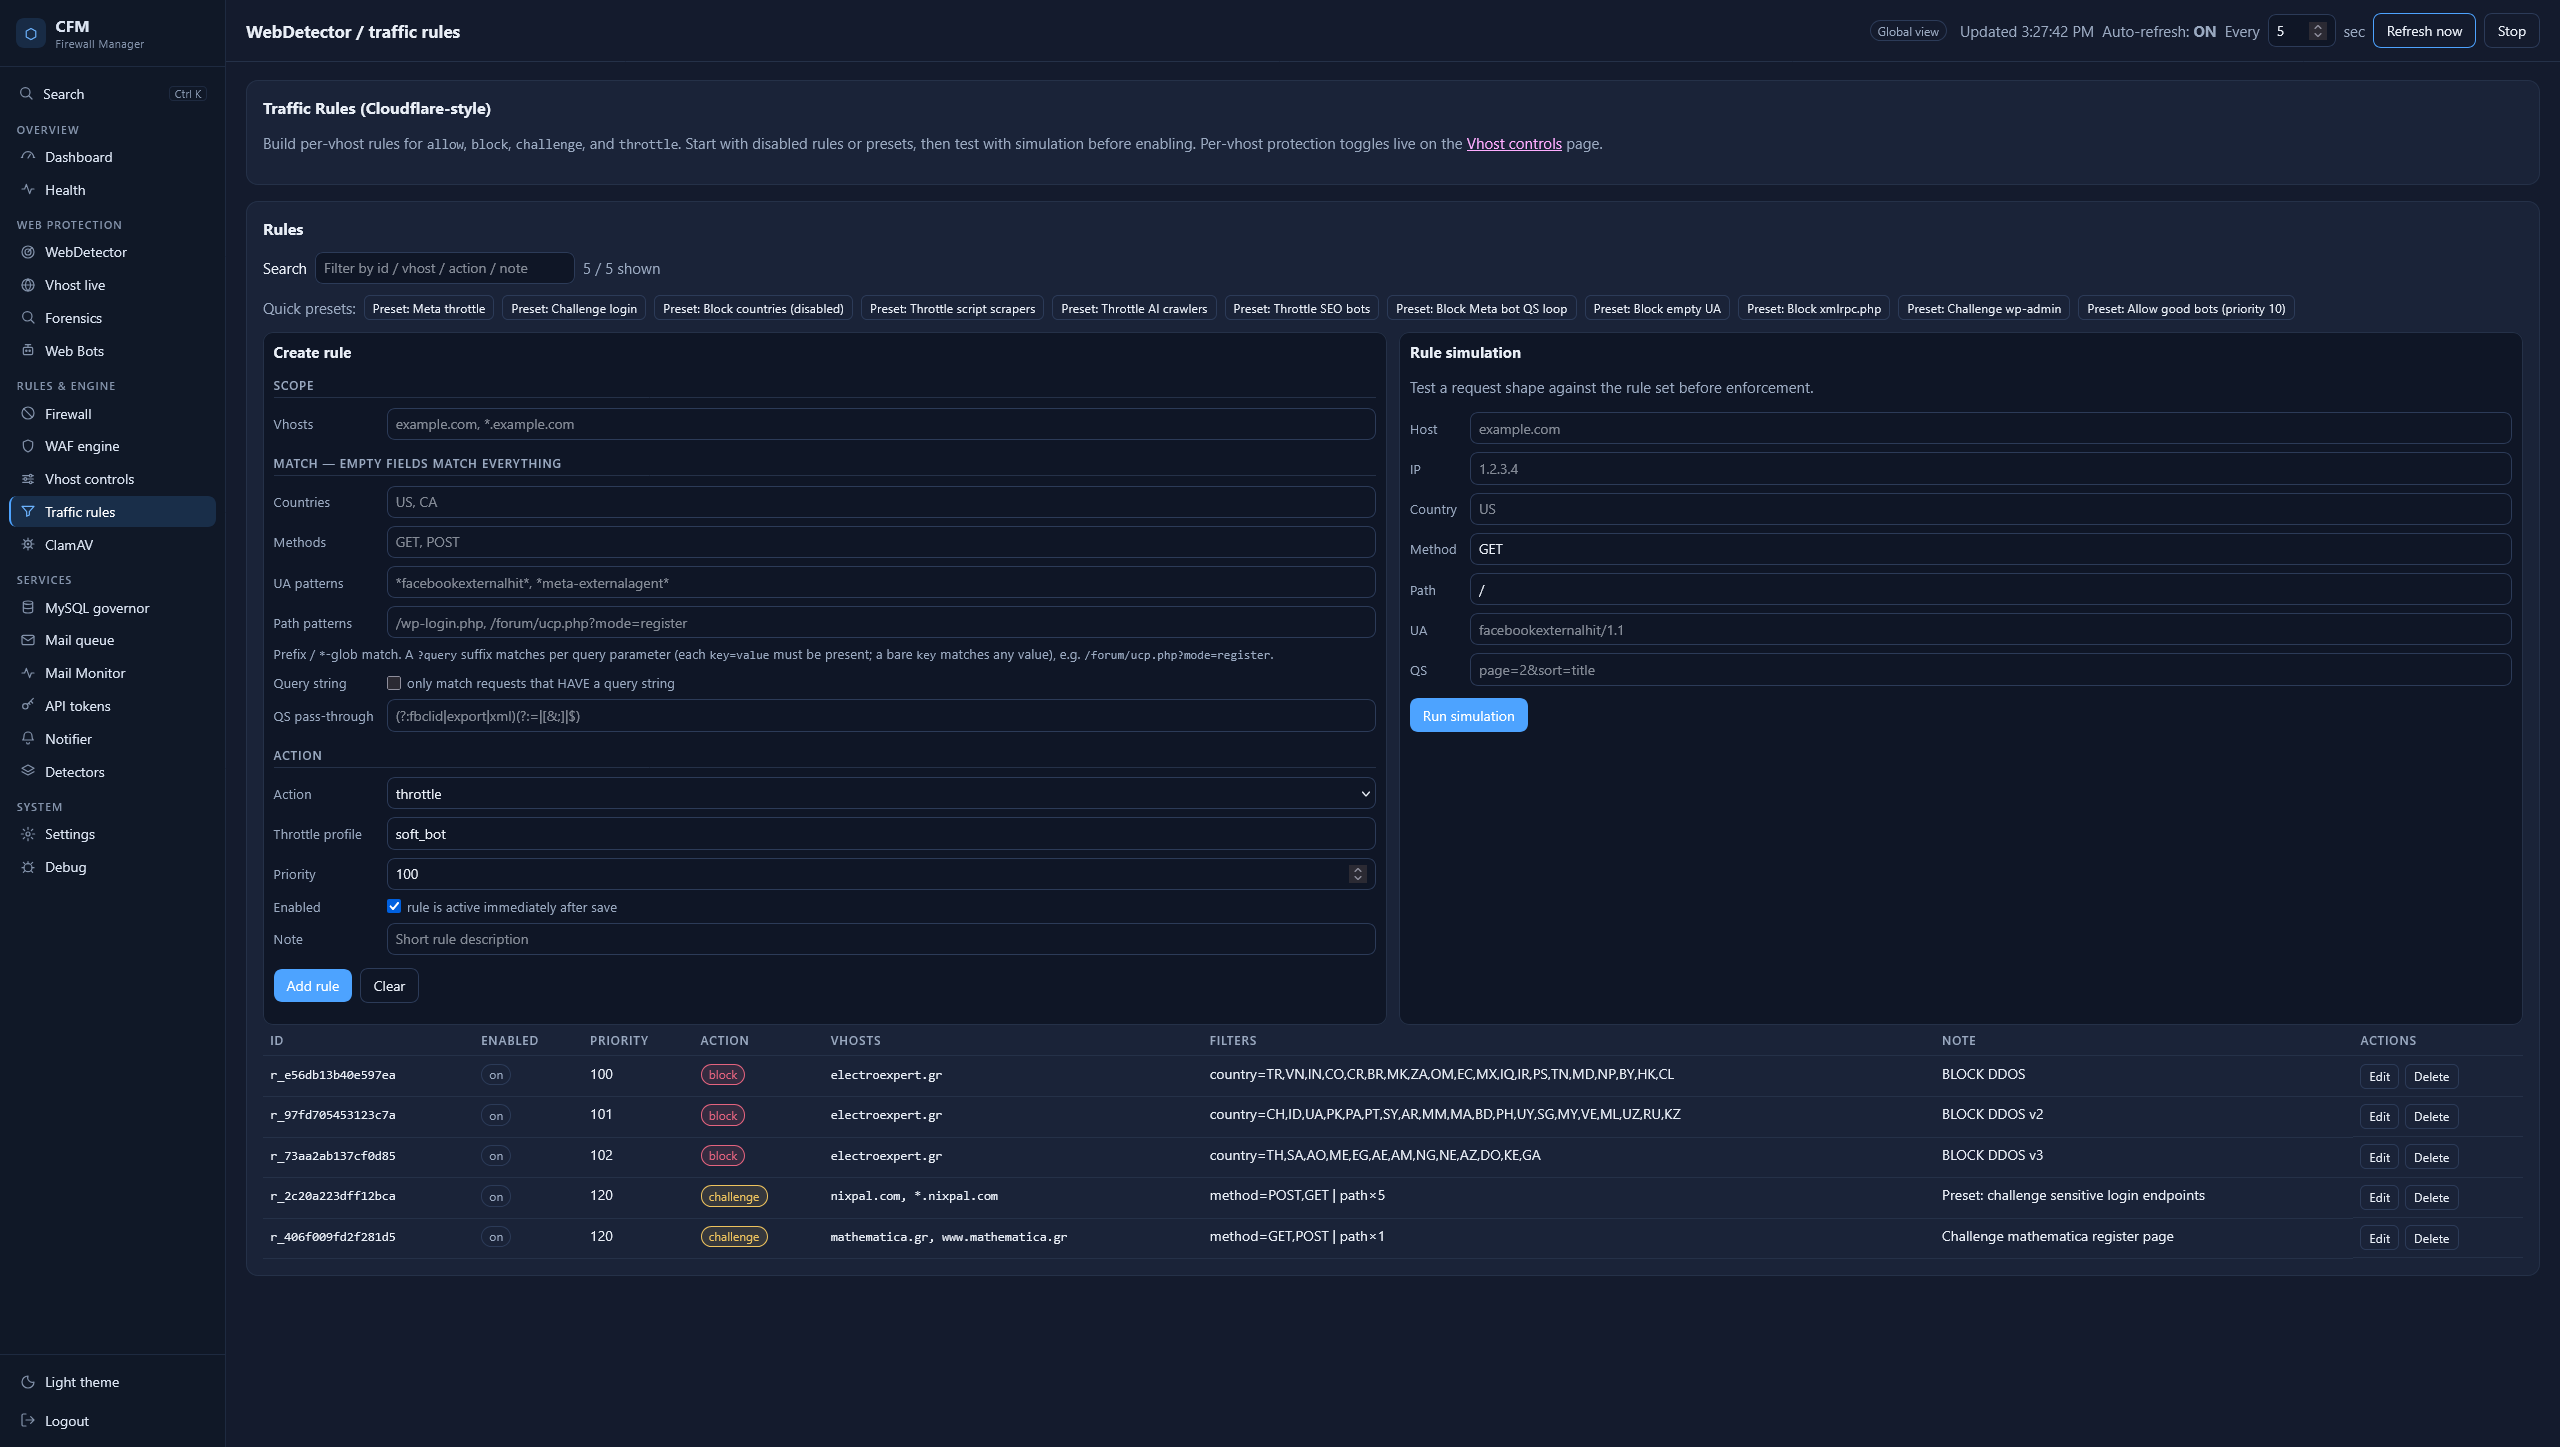
Same for the crowded Vhost-controls page: the Cloudflare-style per-vhost traffic rules moved to their own page, scoped API tokens moved to theirs. Vhost controls kept the toggles grid and the security overview, with links across. No API changed — it was purely a question of what belongs on one screen.
Seven things I’d tell someone building the same thing
1. Every row needs the action next to the evidence
The old flow was: see something suspicious in the UI, switch to a terminal, type the block command, come back, refresh. That’s not a UI, that’s a report.
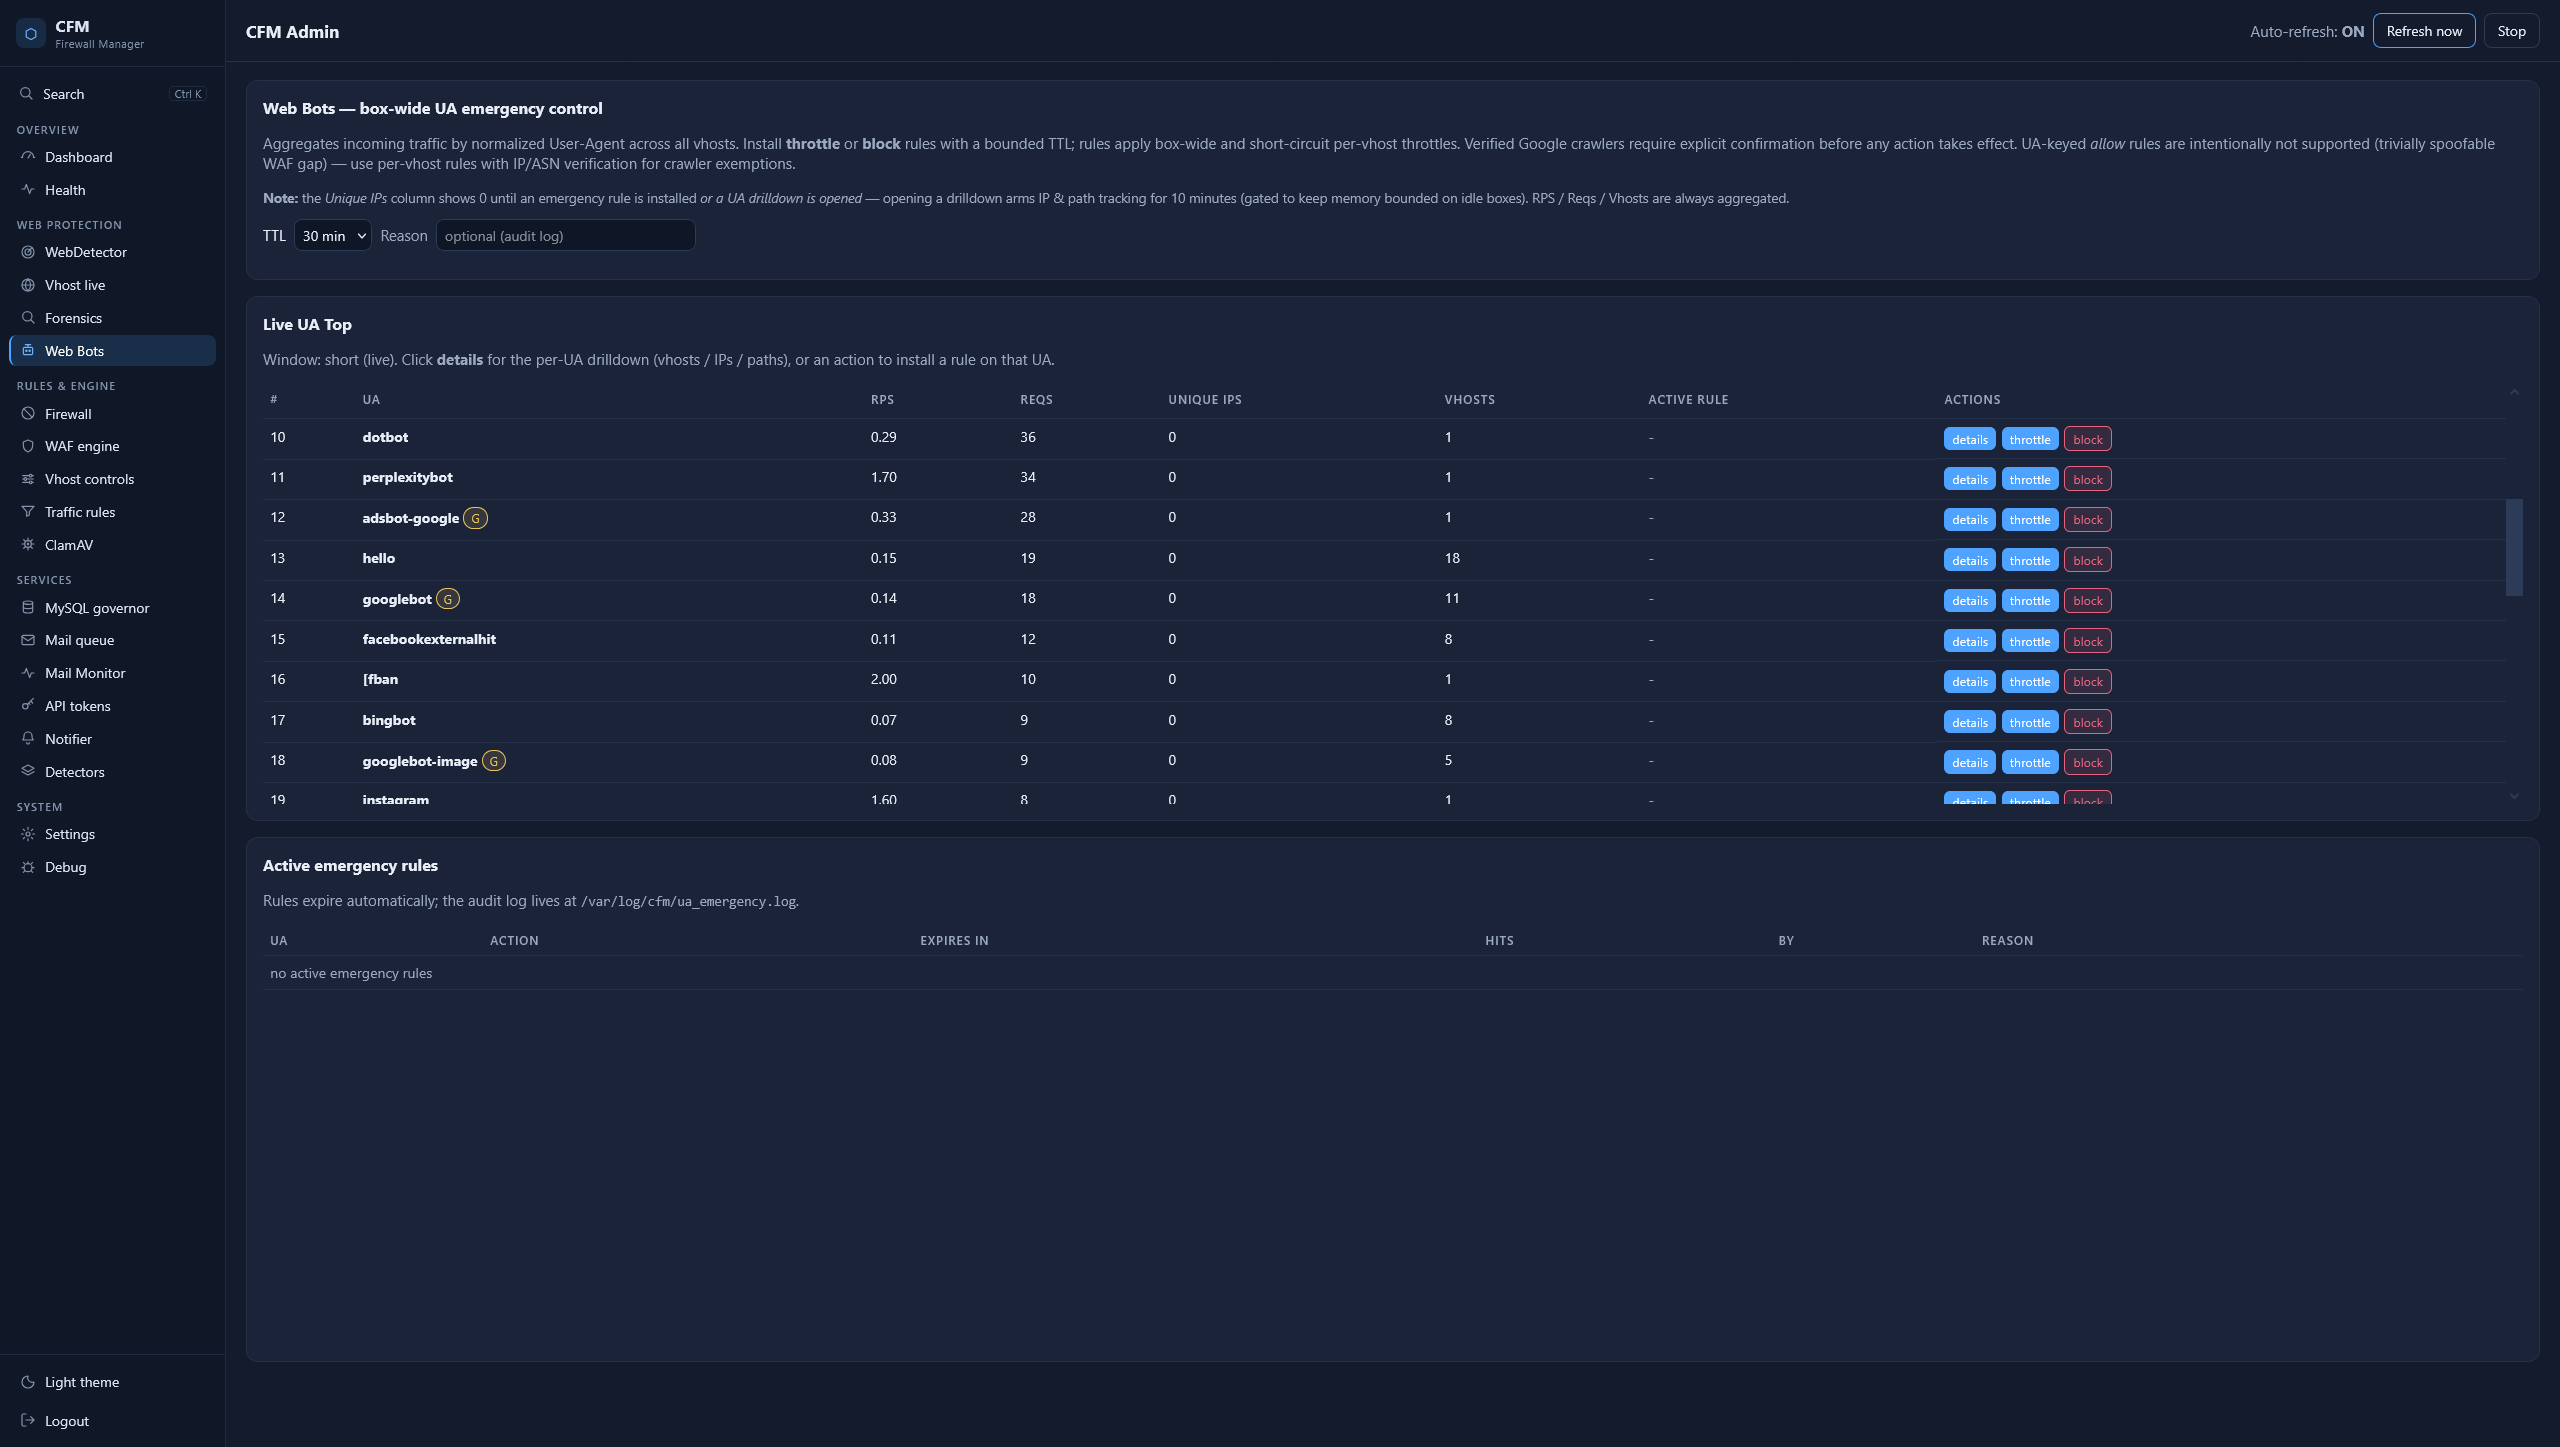
Now every row in every table carries its actions: Challenge · Live · Forensics · History on a vhost, Challenge · Block 1h · Analyze · History on an IP, with the TTL and reason taken from a toolbar control at the top of the table. The Web Bots per-UA drilldown shows which vhosts a UA hits (with a per-vhost challenge action), which IPs (with a per-IP block action), top paths, and the raw UA variants that collapsed into the normalized key — and every vhost and IP cell deep-links back into the drilldown for that entity.
The rule I ended up with: if you can see it, you can act on it, and the action carries the context you were already looking at.
2. The UI is allowed to change backend behaviour — deliberately
The per-UA IP sets used to accumulate only while an emergency rule was active. Which produced the worst possible operator experience: to find out who a user-agent actually is, you first had to install a rule against it. You had to act before you could look.
So GET /api/v1/webdet/ua-drill now arms detailed per-UA tracking (unique IPs + top paths) for ten minutes as a side effect of opening the drilldown, and the panel re-arms while it stays open. Opening the microscope turns the microscope on.
That’s a real coupling between a UI affordance and daemon state, and I want to be honest that it’s a deliberate exception rather than a pattern. It’s bounded (10 minutes, capped at 200 distinct paths per UA per bucket) and it’s visible: the response carries ip_tracking_active: false while data is still warming, and the panel says so instead of showing an empty table.
3. The UI must never lie, and “I don’t know” is a legitimate value
This one cost me the most rework.
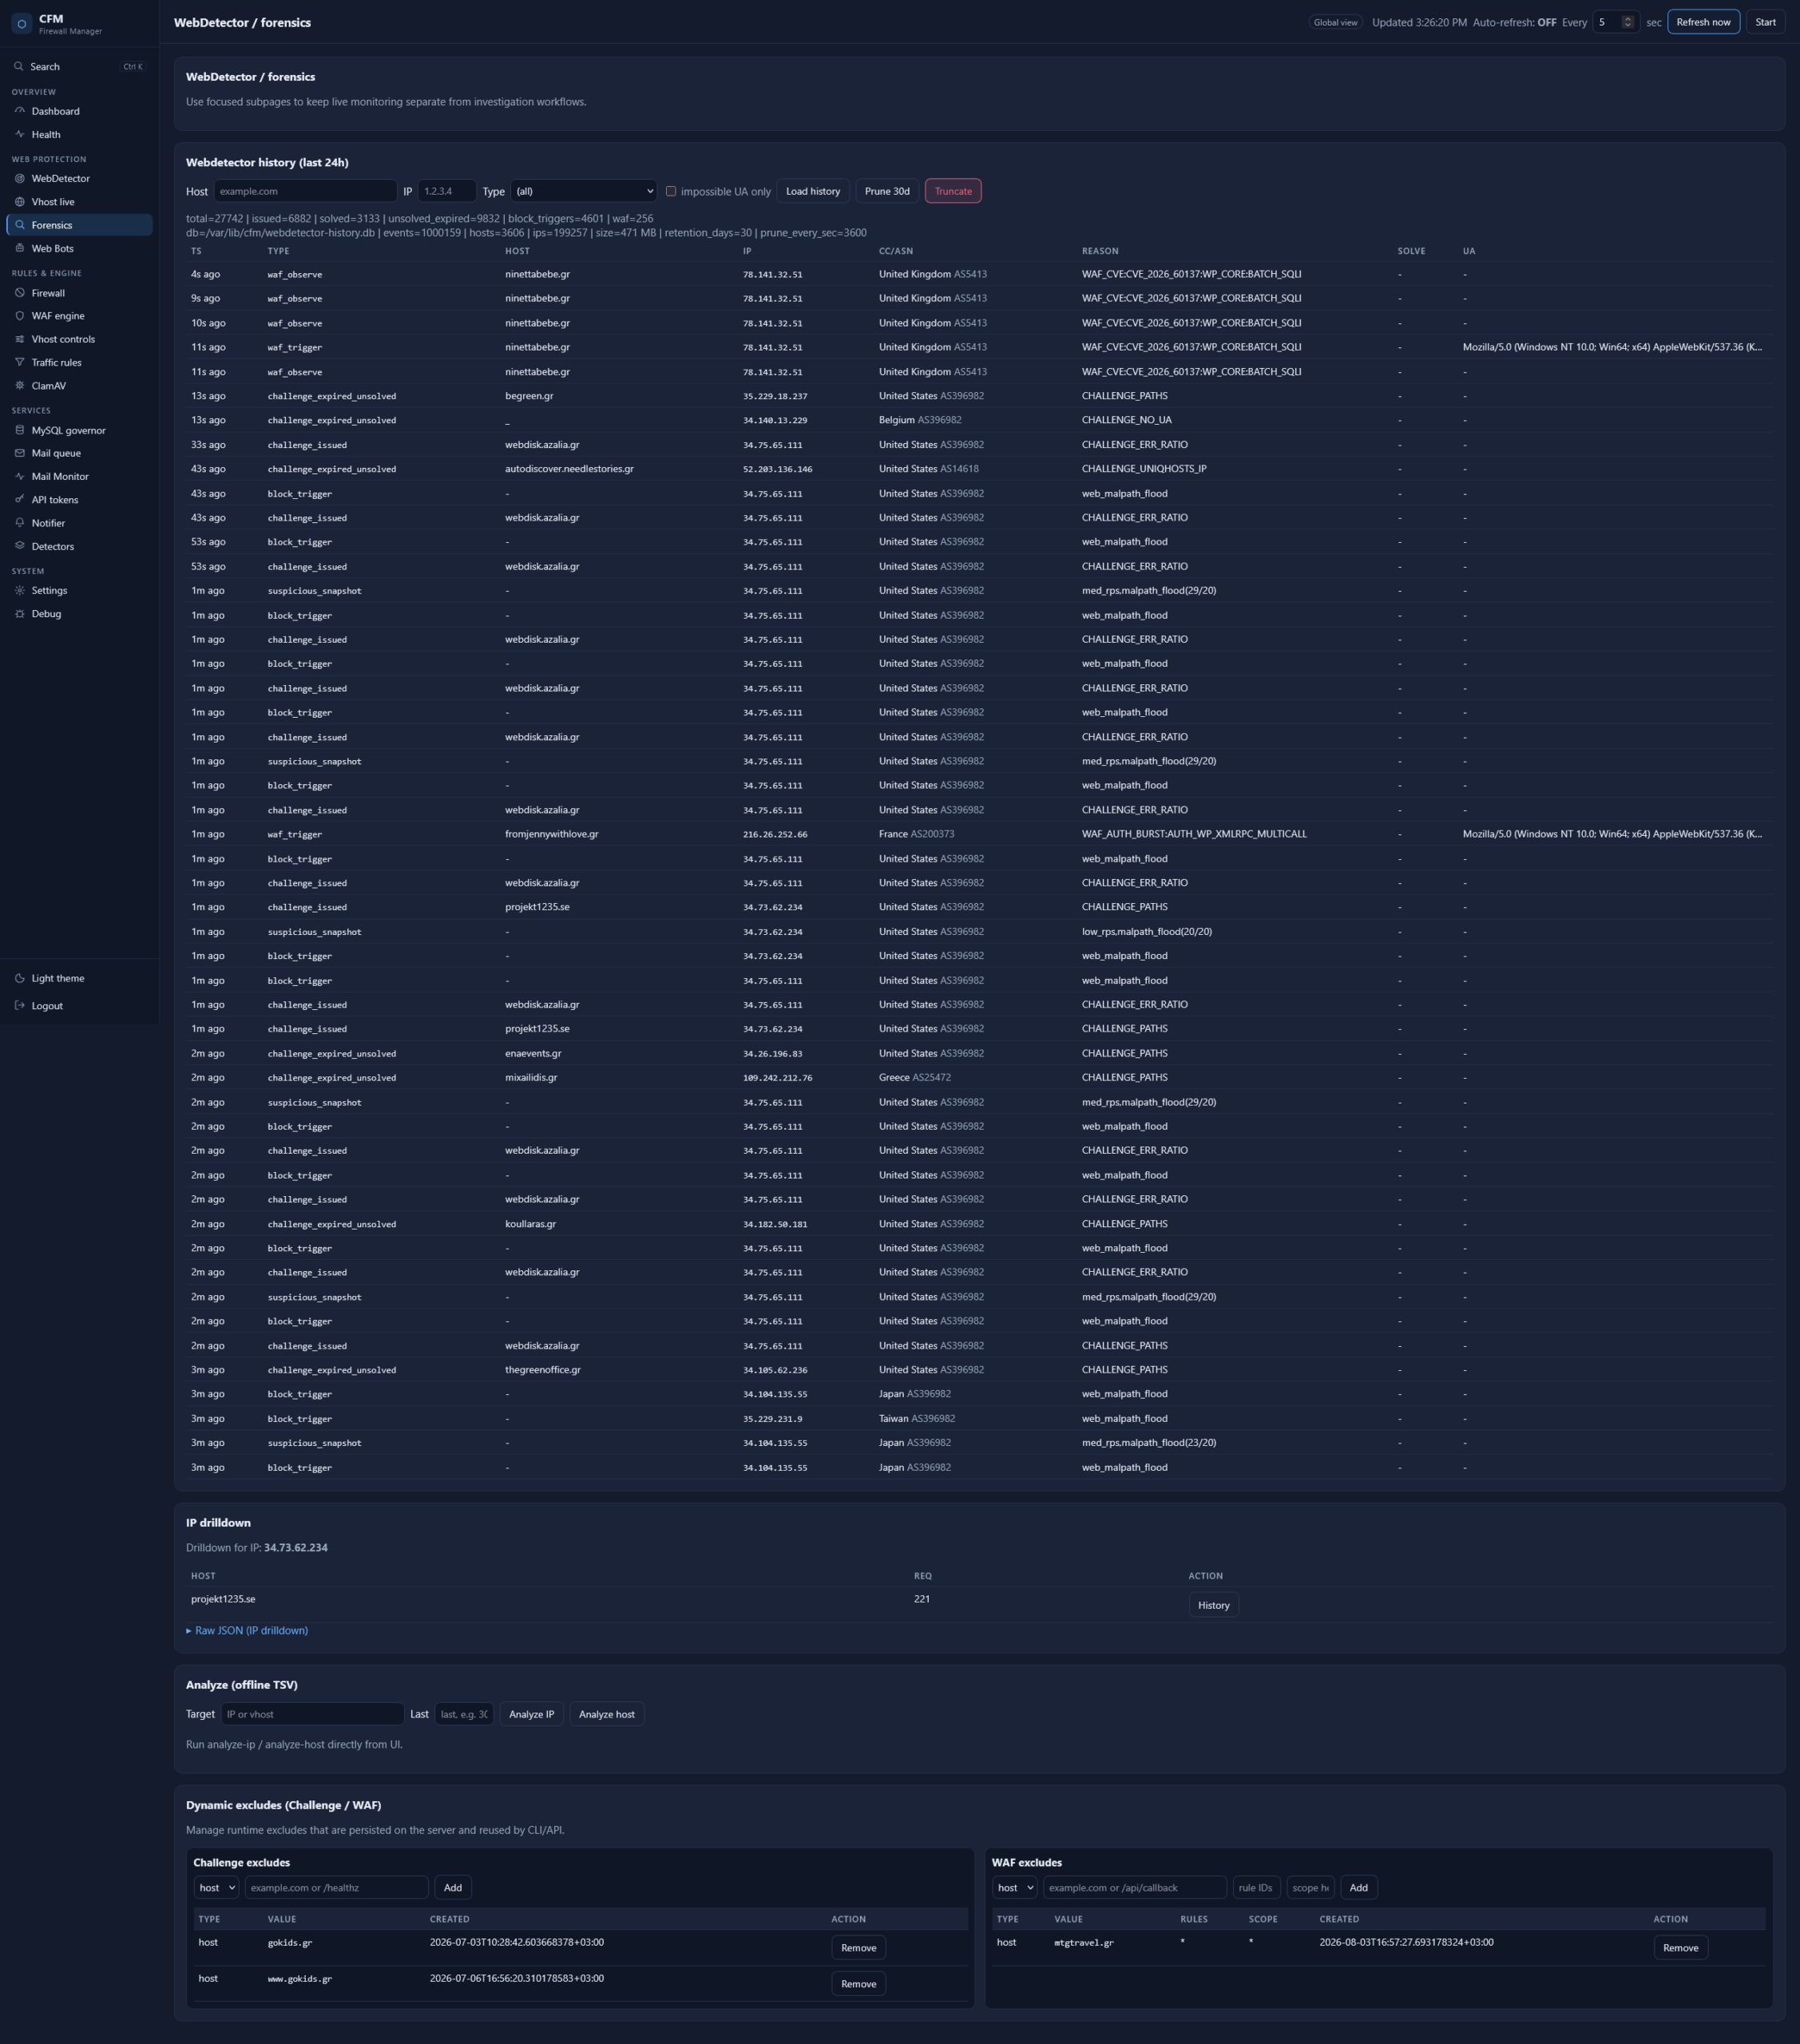
The forensics table has a Solve column — the real client-side latency of a proof-of-work challenge. For a long time, “unknown” rendered as 0ms, which is not just wrong, it’s confidently wrong: it reads as “this client solved a PoW instantly”, i.e. exactly the signal of an automated solver. The column now renders 892ms, 1.4s, or -, and never a misleading zero. The tooltip separates the real client-side solve latency from the legacy server-side verify time, because those are different numbers and I had been silently conflating them.
Same principle, elsewhere:
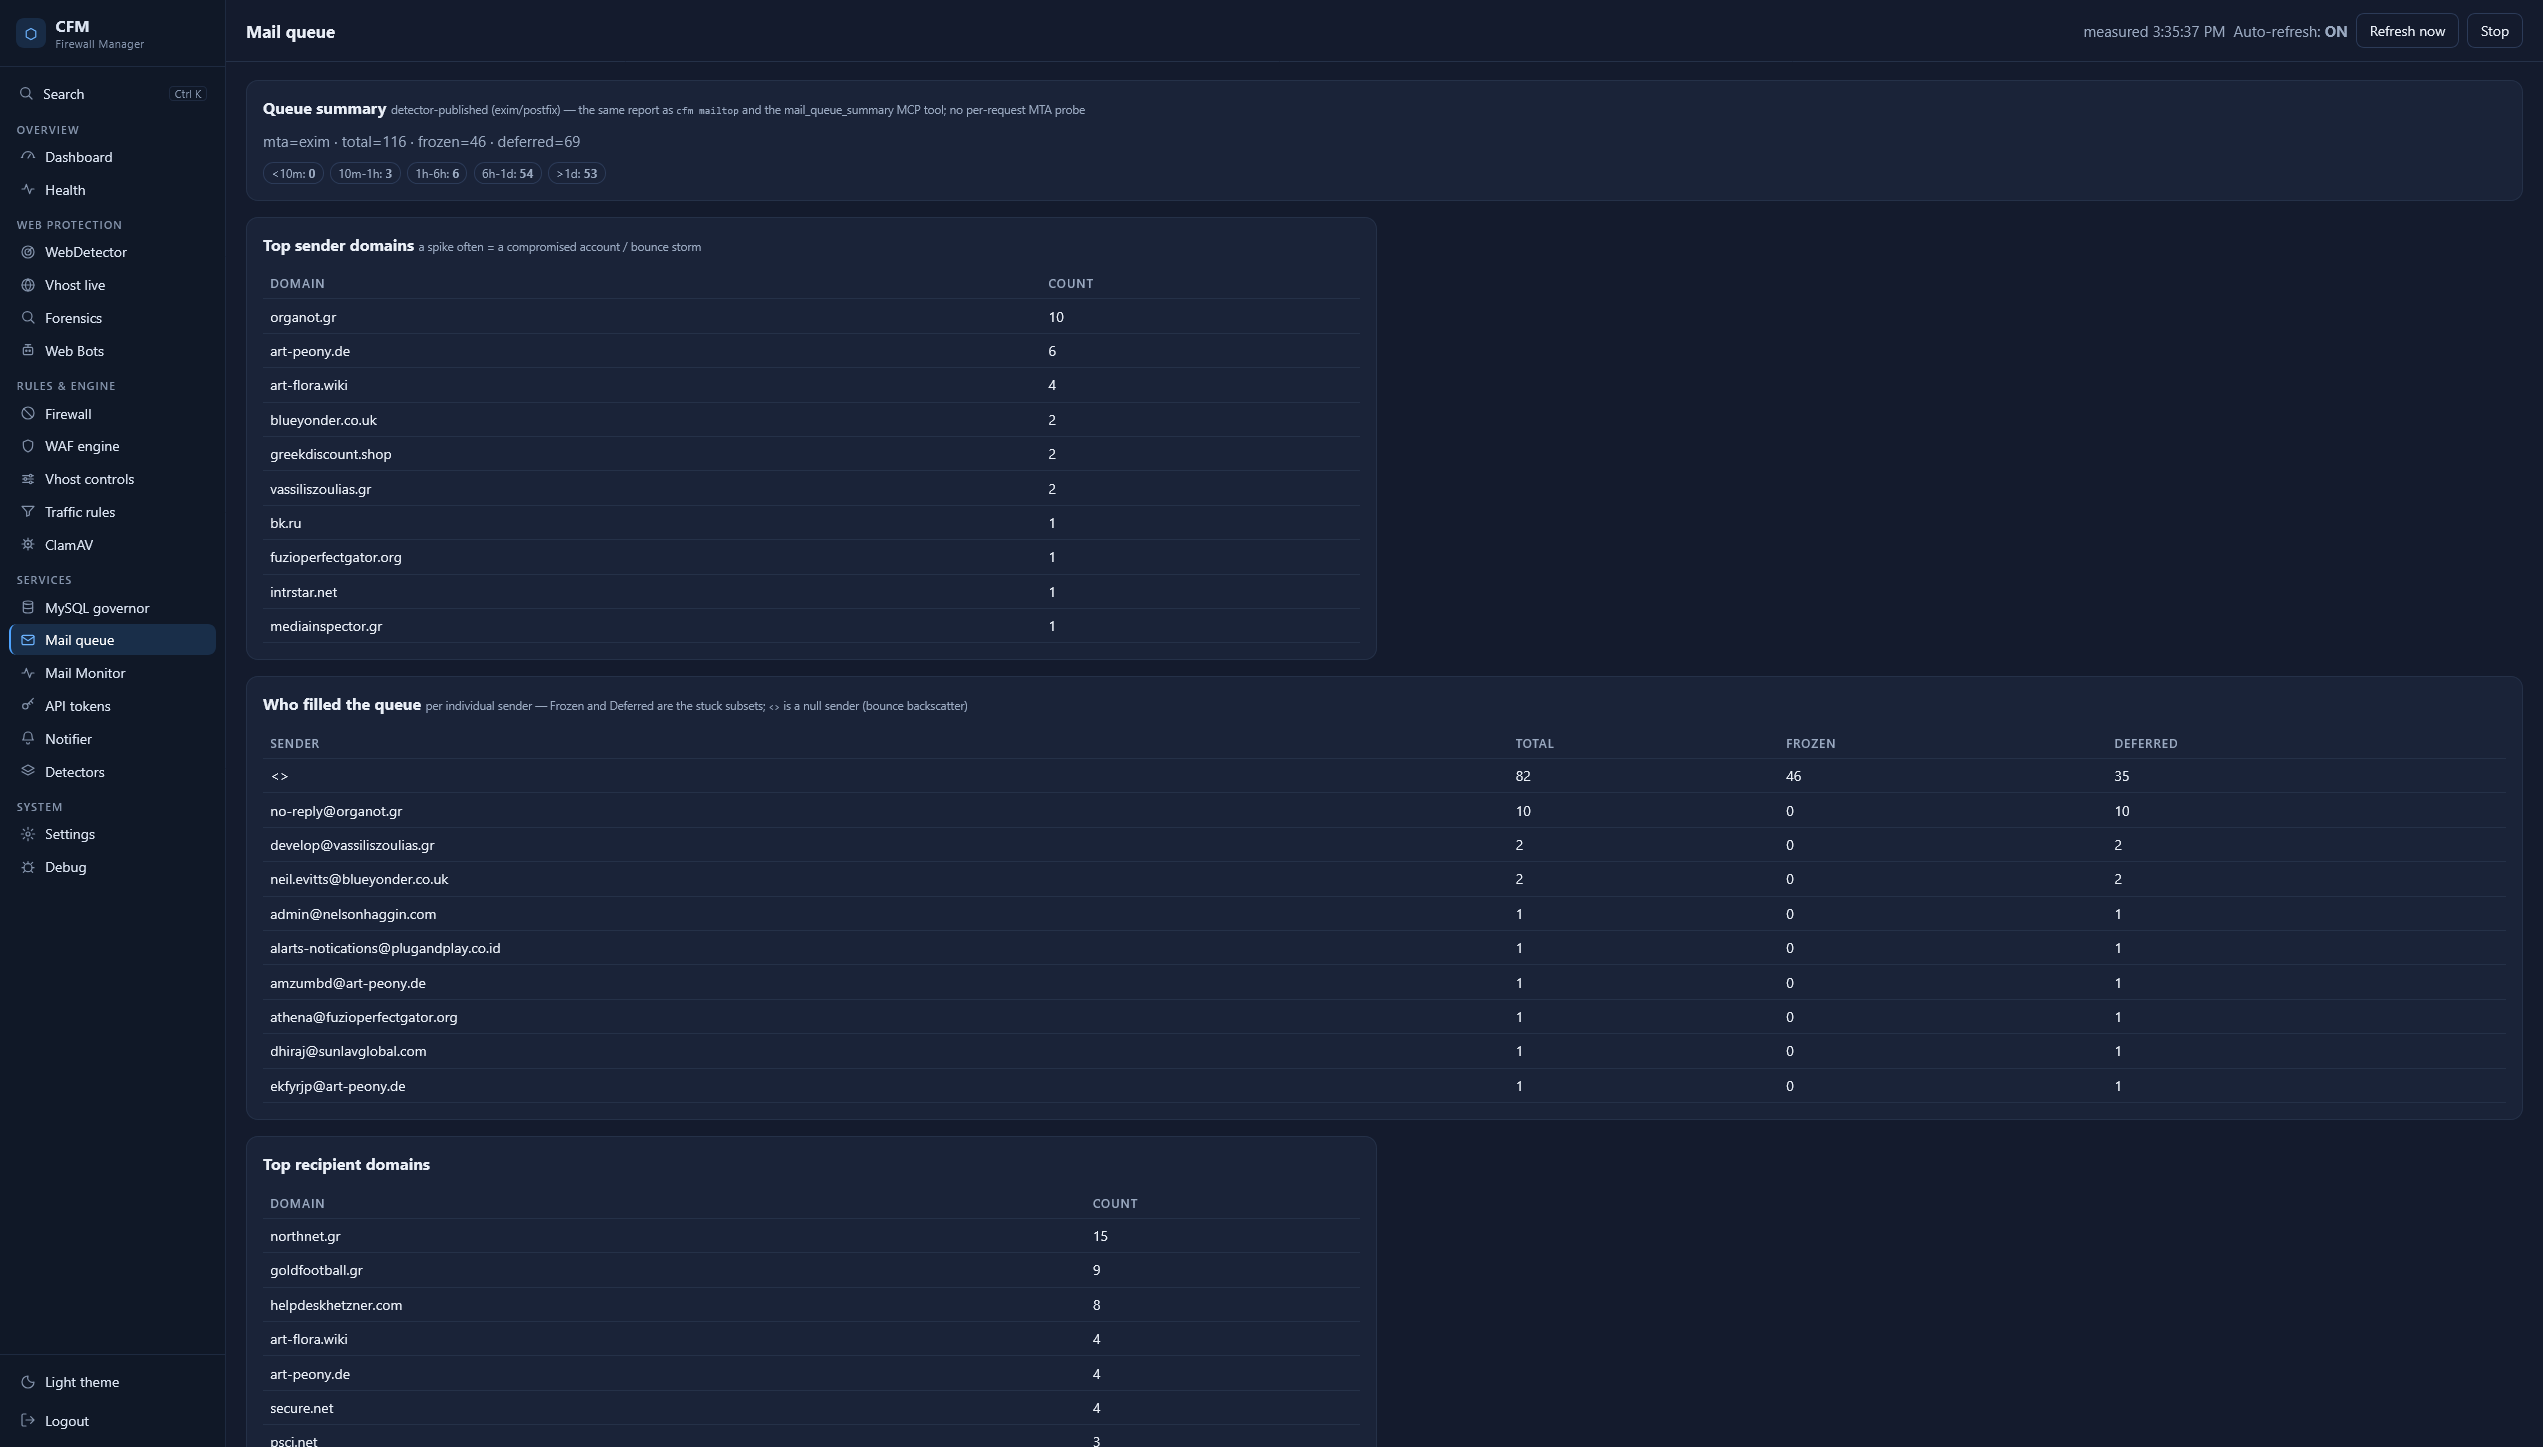
- The Mail queue page shows “no queue detector is enabled yet” rather than a page of zeros. Zero frozen messages and “we aren’t measuring frozen messages” are not the same claim.
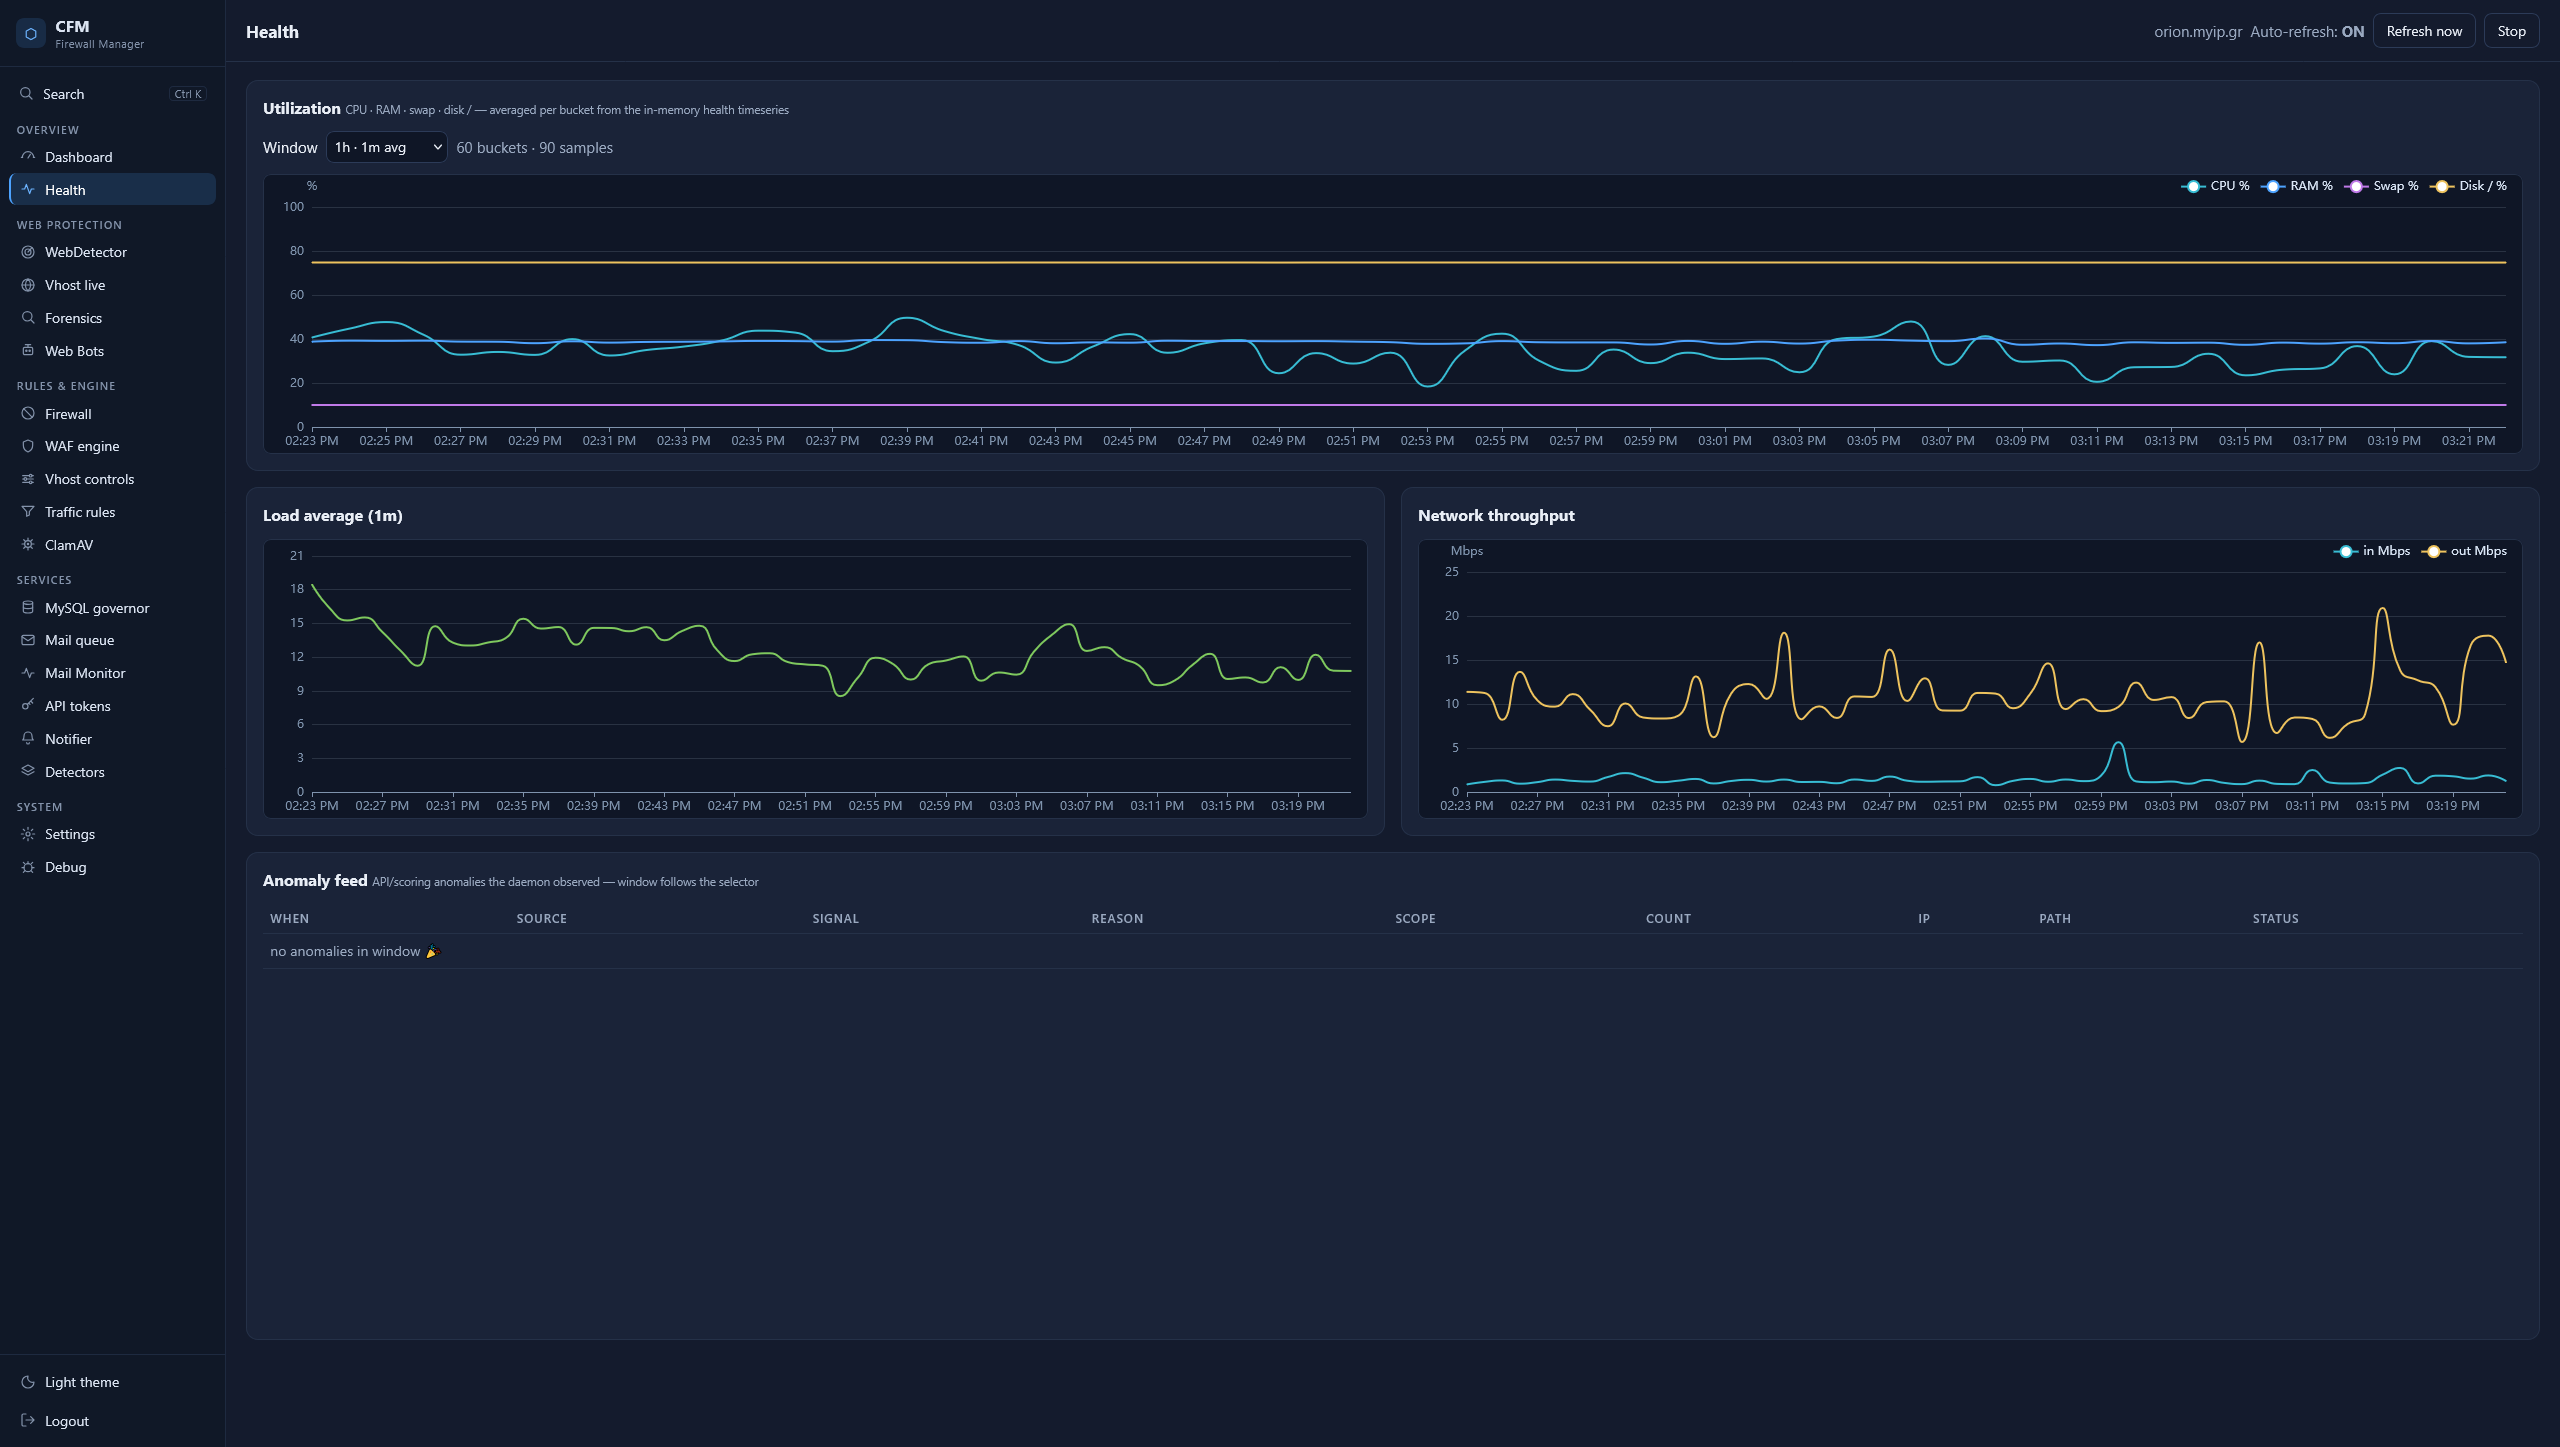
- The health page’s anomaly feed says “no anomalies in window” — scoped to the window selector, not to all time.
- An
impossiblepill appears next to a self-contradictory User-Agent, with the matched rules in its tooltip, so the verdict is inspectable rather than a magic badge.
If the daemon doesn’t know something, the UI’s job is to say so, not to render a plausible number.
4. Scope is a security property, not a display filter
CFM’s panel can be handed to a scoped viewer — a cPanel reseller who should see their own domains and nothing else. It would be very easy to implement that as “hide the rows that don’t match” in the frontend.
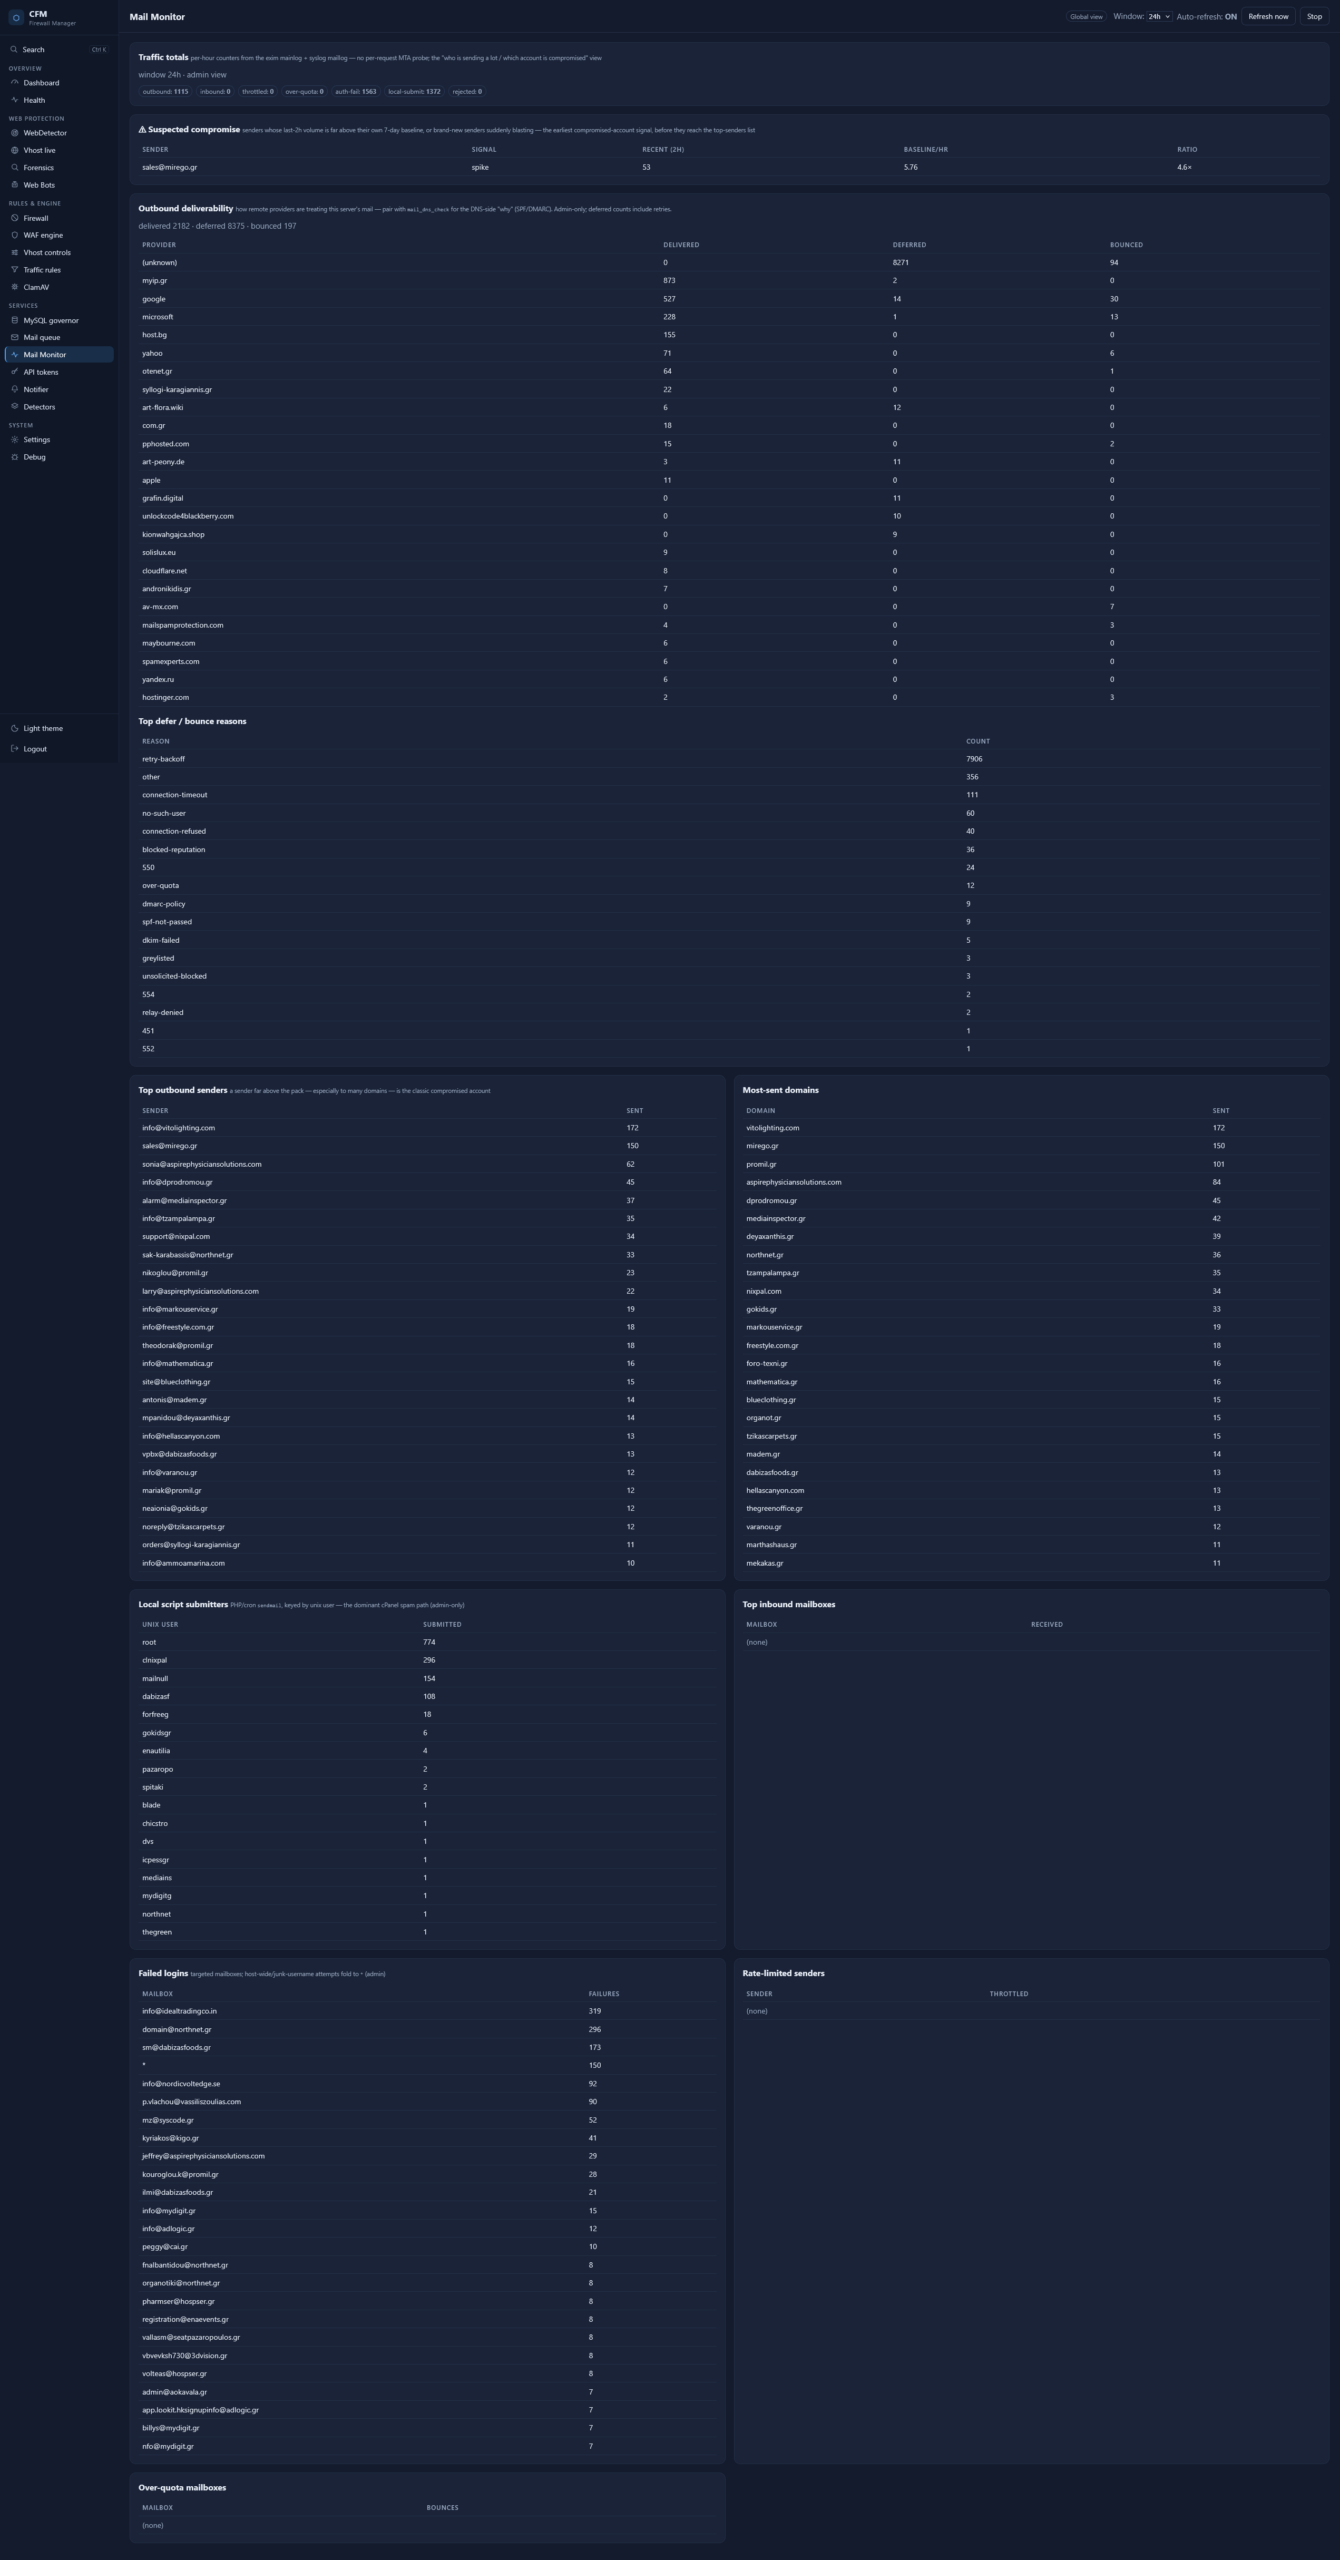
Instead it’s enforced at the backend and fails closed: admin-only pages 403 and their nav links don’t render; on the Mail Monitor page, a scoped viewer’s window is filtered to their own domains and the host-wide cards (local unix-user submitters, host-wide rejected counts) don’t exist for them by construction, not by CSS. The local-script submitter view keys on the unix user — on a shared cPanel box that’s the dominant spam path, and it’s also exactly the kind of cross-tenant information a scoped viewer must never get.
The nav is scope-aware for the same reason: a link to a page that will 403 is a bug, not a hint.
5. Observing the box must not be the heaviest thing on the box
My favourite bug of the whole cycle, because it is the purest form of the mistake.
The daemon sat pinned at ~40% CPU. Cause: an open dashboard tab. The Security overview card polled /api/v1/waf/engine/summary every 10 seconds, and the handler read the entire history_events table — every event type, unbounded in time, millions of rows on a busy node — and filtered the WAF-in-window rows in Go. That’s ~1.4 GB of allocations per call. Over one observed hour: 543 GB cumulative, roughly 28 CPU-minutes of JSON decode and GC, with a ~1.9 GB heap peak.
The monitoring UI had become the single largest load on the machine it was monitoring.
The fix is unglamorous — window and type-filter in SQL (event_type IN (waf_observe, waf_trigger) AND ts_unix >= from, served by an index that already existed), which turns millions of rows into thousands — plus a regression test asserting the filtering happens SQL-side. Two neighbours fell in the same sweep: the dashboard’s 10s refresh was spawning a cfm CLI subprocess on nearly every poll for /v1/system/dnat and /v1/system/ssl/stats, and each ssl stats run triggered a daemon-side cert refresh and dumpall — another ~50 GB of allocations an hour on a 2,300-cert box. Both got sane cache TTLs.
The general rule that came out of it: a read that a dashboard polls is a different kind of code from a read a human runs once. /api/v1/health/snapshot now takes an opt-in ?cache_ttl= and serves stale-while-revalidate, so a 10s auto-refresh costs one ~1-2s collection per minute instead of one per poll — while cfm health on the CLI still gets a fresh collection, because that’s what a human typing a command expects. The response reports collected_at so the age is never hidden.
And when a UI control implies data that doesn’t exist, the store has to grow to match: adding a 24h window to the health page meant raising the health ring buffer from 720 samples (2-4 hours at the sampler’s cadence) to 8,640. About 1 MB per node. Offering a window you can’t fill is the same sin as rendering a fake zero.
6. Same data everywhere, one source
Every surface — CLI, REST API, MCP, WebUI — reads the same computed artefact. The Mail queue page renders the report the queue detector already publishes each poll; it does not shell out to postqueue. The Mail Monitor page reads the same GET /api/v1/mail/traffic as the mail_traffic MCP tool and the CLI, all served from persisted per-hour counters rather than a live MTA probe.
The payoff isn’t code reuse, it’s trust. When the UI, the CLI and the MCP tool disagree about the state of the world, an operator stops believing all three. A subsystem isn’t done until all four surfaces show the same numbers.
The on-demand log readers follow one discipline too: bounded tail from EOF, a timeout, an optional case-insensitive grep, capped output, path resolved from a fixed per-service candidate list and never from the caller. found: false when a service isn’t logging at a known path — a fact, not an error.
7. Boring shell, dense content
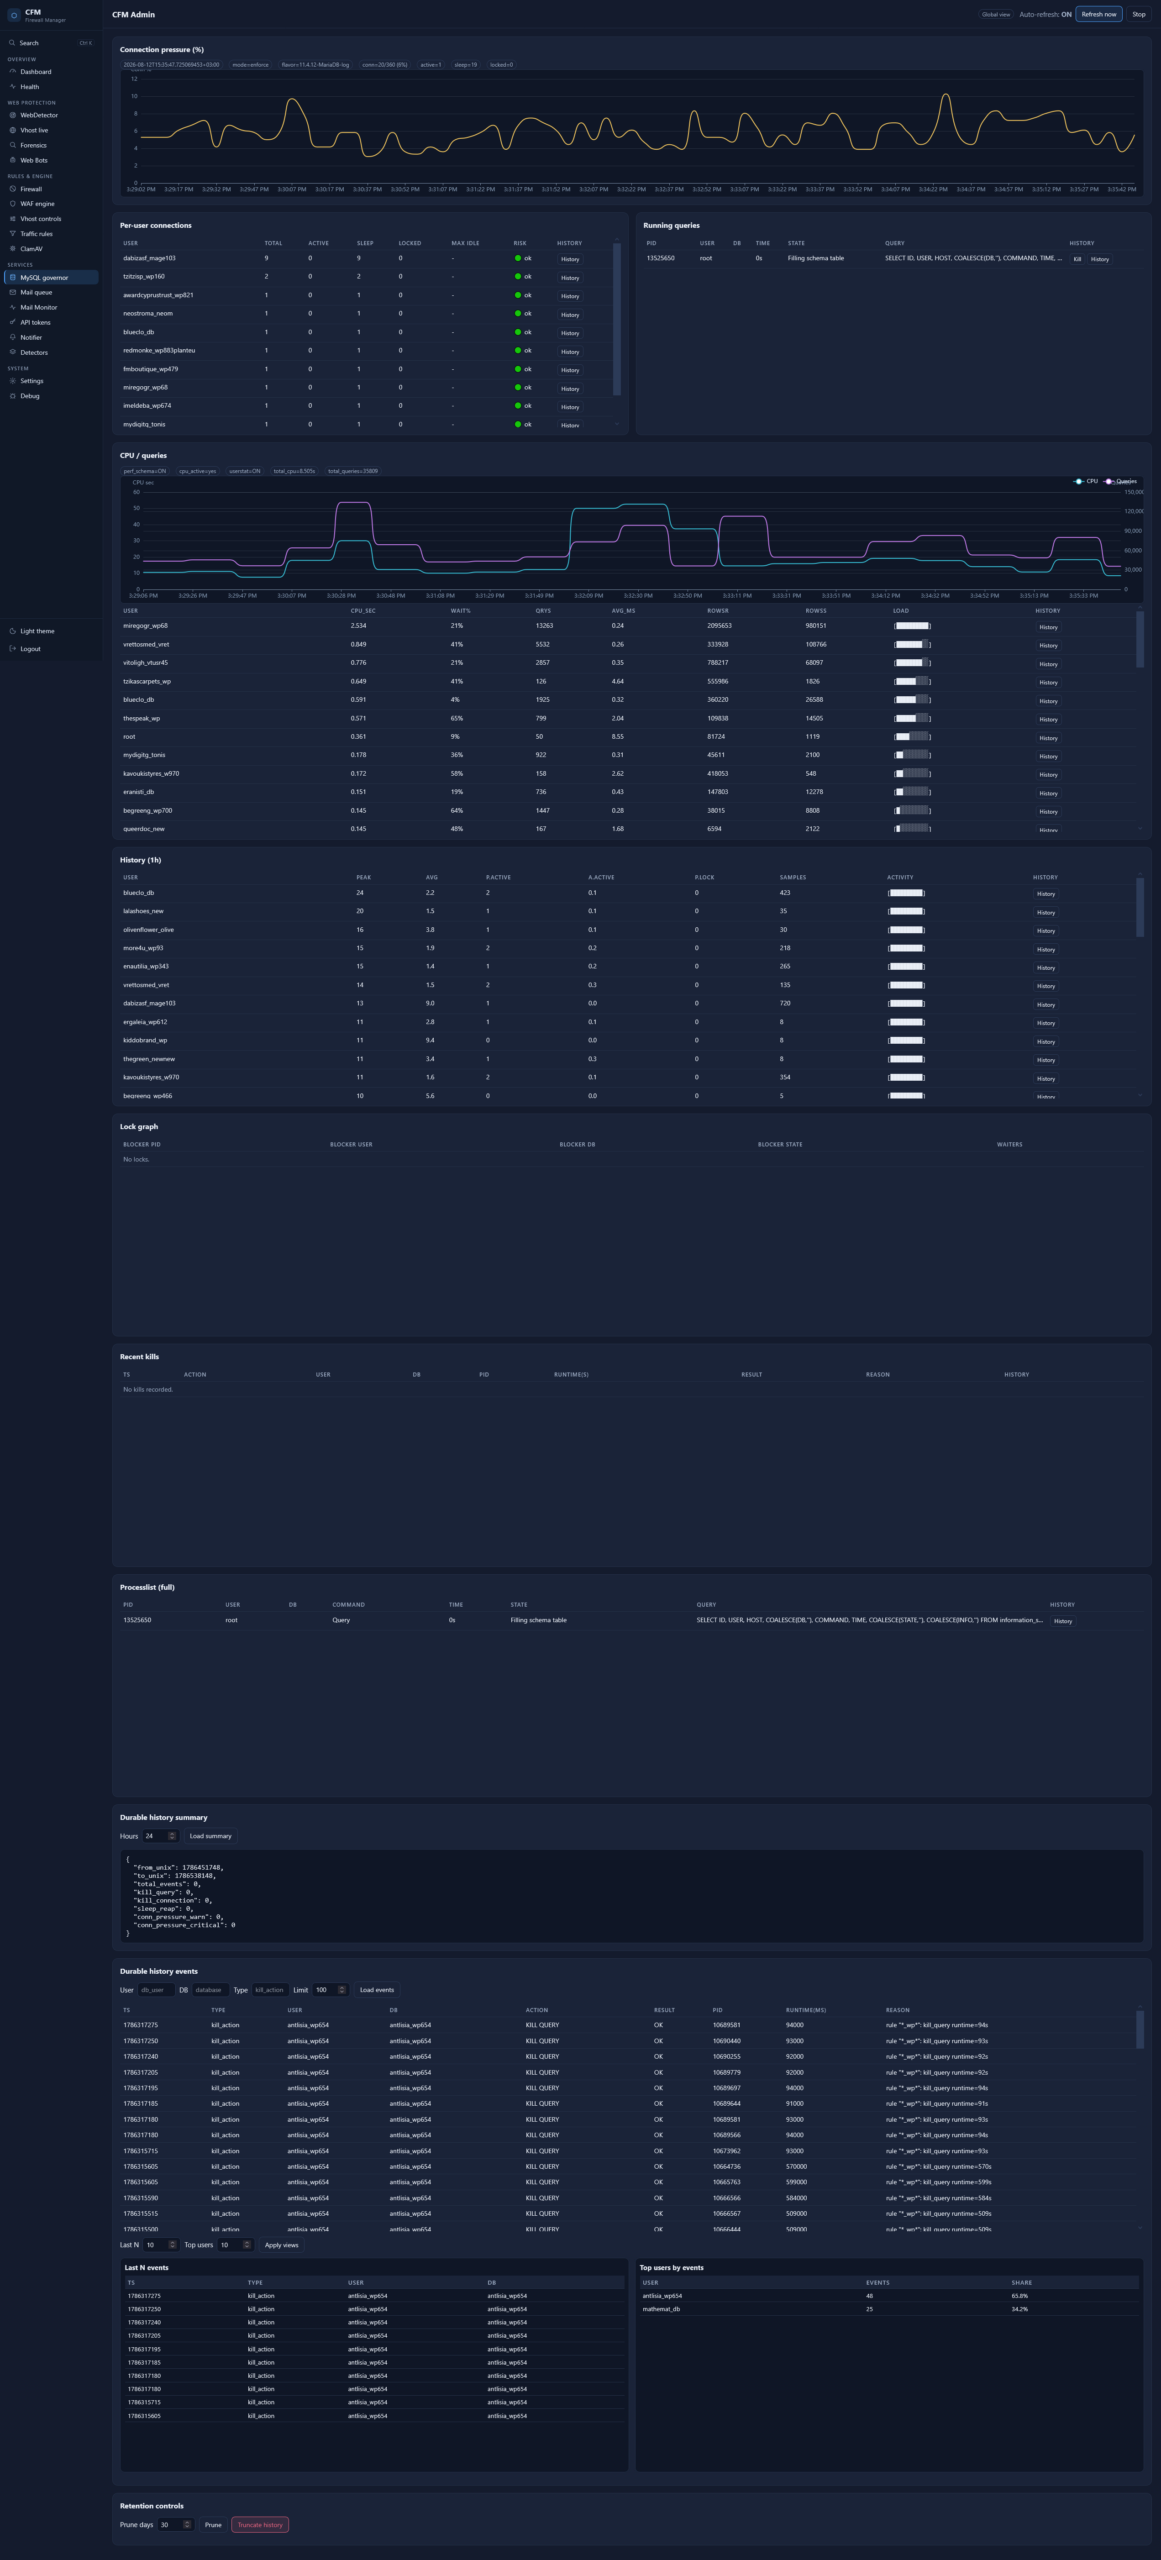
The chrome is deliberately unremarkable: a dark shell, a fixed left rail grouped by intent — Overview (Dashboard, Health) · Web protection (WebDetector, Vhost live, Forensics, Web Bots) · Rules & engine (Firewall, WAF engine, Vhost controls, Traffic rules, ClamAV) · Services (MySQL governor, Mail queue, Mail Monitor, API tokens, Notifier, Detectors) · System (Settings, Debug) — a Ctrl-K search palette with per-host quick actions, a global-view toggle, an explicit auto-refresh control with a visible interval and a Stop button, and a light-theme switch at the bottom.
Nothing there is clever. That’s the point: the interesting thing on the screen should be the data, and on a security panel the data is dense — sparkline tiles for CPU/load/RAM/swap/conntrack/mail-queue/net, a chip row for edge and runtime state, per-mount disk and inode bars, SMART/wearout per device, shared-dict memory for the Lua side. An operator scanning that at 3am wants information density and a layout that hasn’t moved since yesterday, not an animation.
While we were at it: what CFM actually does now
The UI work sat on top of a busy few months. The short version of the platform:
Firewall. nftables-first, with a second backend and self-diagnostics (per-call lock-wait / netlink / CLI time splits, so a node whose base-ensure time creeps up over a run can be root-caused instead of guessed at). Blocks are attributable: ip_locate answers “where is this IP blocked, across nft / cfm.deny / csf / fail2ban / imunify360 — and why“, carrying each source’s own reason string.
WebDetector + challenge engine. Real-time per-vhost scoring, suspicious-host detection, an interactive proof-of-work / JS challenge that can be armed manually or automatically, and TLS-fingerprint stamping on solves. The engine’s design decisions are written down with the measurements behind them, specifically so they don’t get contradicted later from intuition — including why raising PoW difficulty is a trap while the browser solver runs at 48.8 kH/s against 4.49 MH/s for naive native code (a ~92x handicap that difficulty doesn’t change), and why memory-hard PoW was rejected (verification cost becomes an amplification DoS, and it defends against GPU solvers while the farms we actually observe run real browsers).
In-path WAF with enforcement tiers. Every rule is logonly, challenge or block, and new rules land in logonly and stay there through a burn-in before anything is armed. Autoblock is a separate, deliberate opt-in per family.
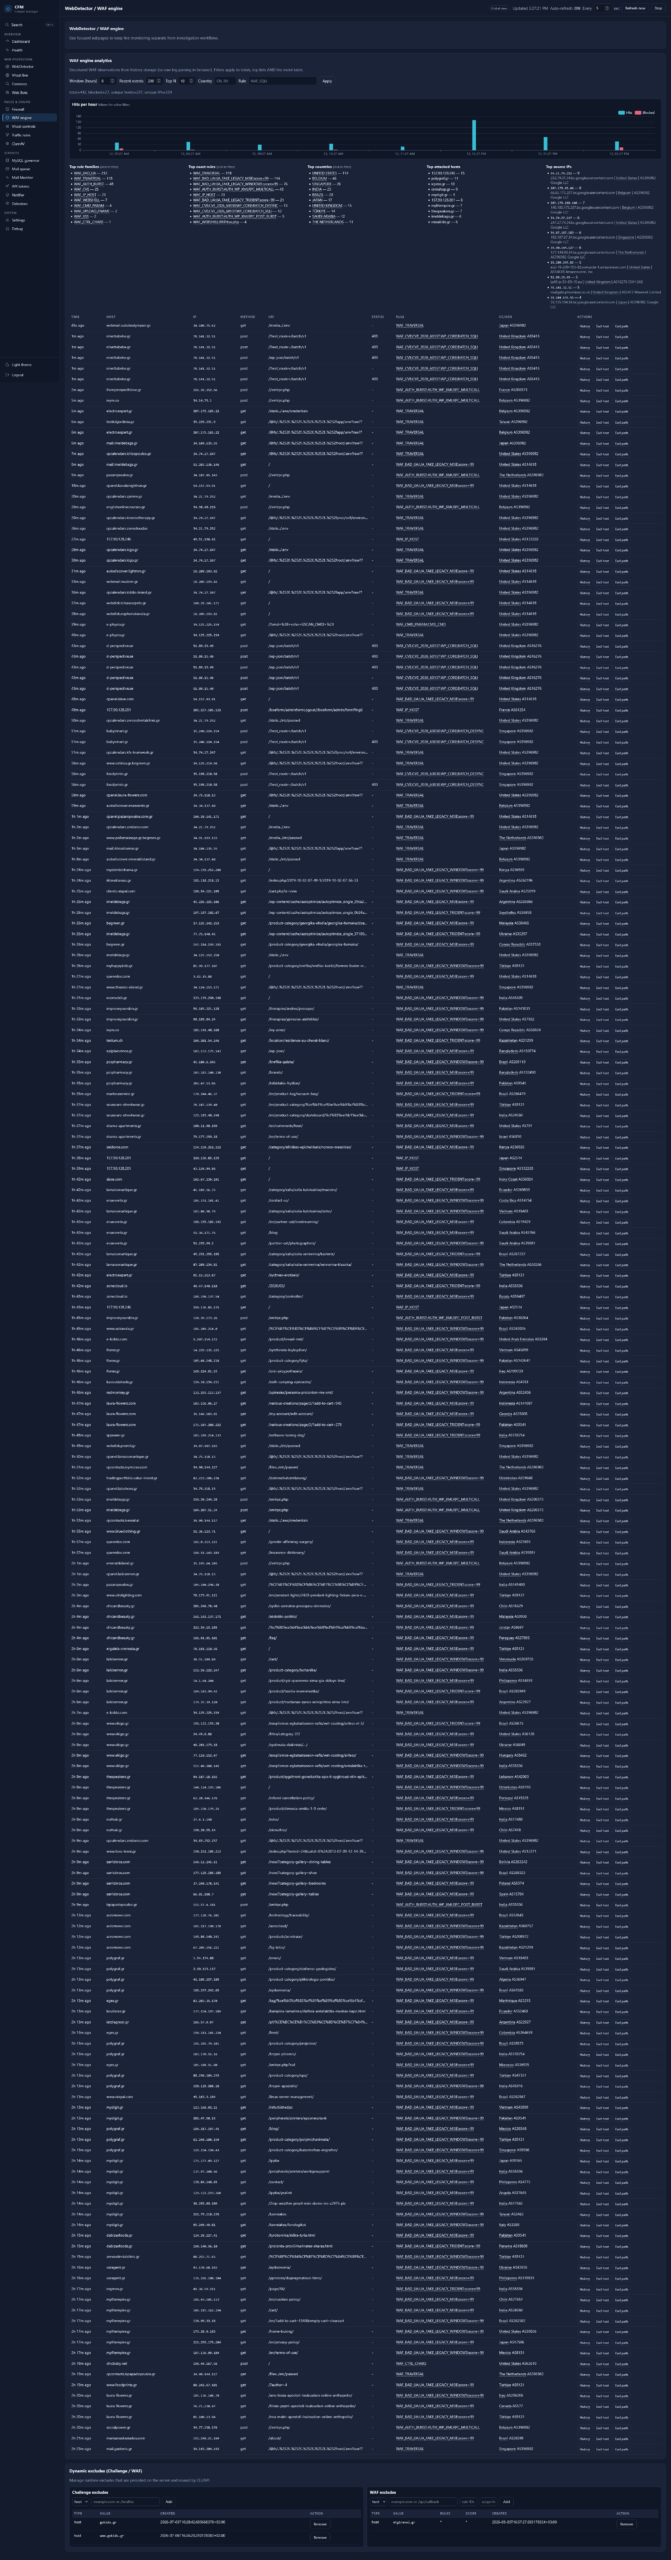
CVE hunting and virtual patching. This is the part I’m happiest about. There’s now a dedicated CVE detector band (rule IDs 10000+, family WAF_CVE, CVE-named alerts) and a written workflow for adding the next one, so it’s a repeatable process rather than a burst of enthusiasm. Shipped detectors cover, among others, the WordPress core “wp2shell” unauth RCE chain (CVE-2026-63030 + CVE-2026-60137 — a bare install with zero plugins is exploitable), the actively-exploited SP Page Builder / Joomla arbitrary upload (CVE-2026-48908, the “ANTONKILL” vector), Multi Uploader for Gravity Forms, Kirki, Avada/Fusion Builder, Post SMTP, W3 Total Cache, Slider Revolution, LiteSpeed Cache, Ninja Forms File Uploads, and Joomla JCE.
Two things I insist on for each one. Signatures come from the public PoC, not from memory — a plausible-looking regex written from a CVE description is worse than no rule, because it produces false confidence and false positives at the same time. And each detector is scoped to the specific field value, not the whole request body: the wp2shell SQLi leg matches an author_exclude / author_not_in value that isn’t a clean integer list, so a legitimate batch request that merely mentions author_exclude in post prose isn’t blocked — and because the check is technique-agnostic, it can’t be dodged with /**/ or # comment obfuscation either.
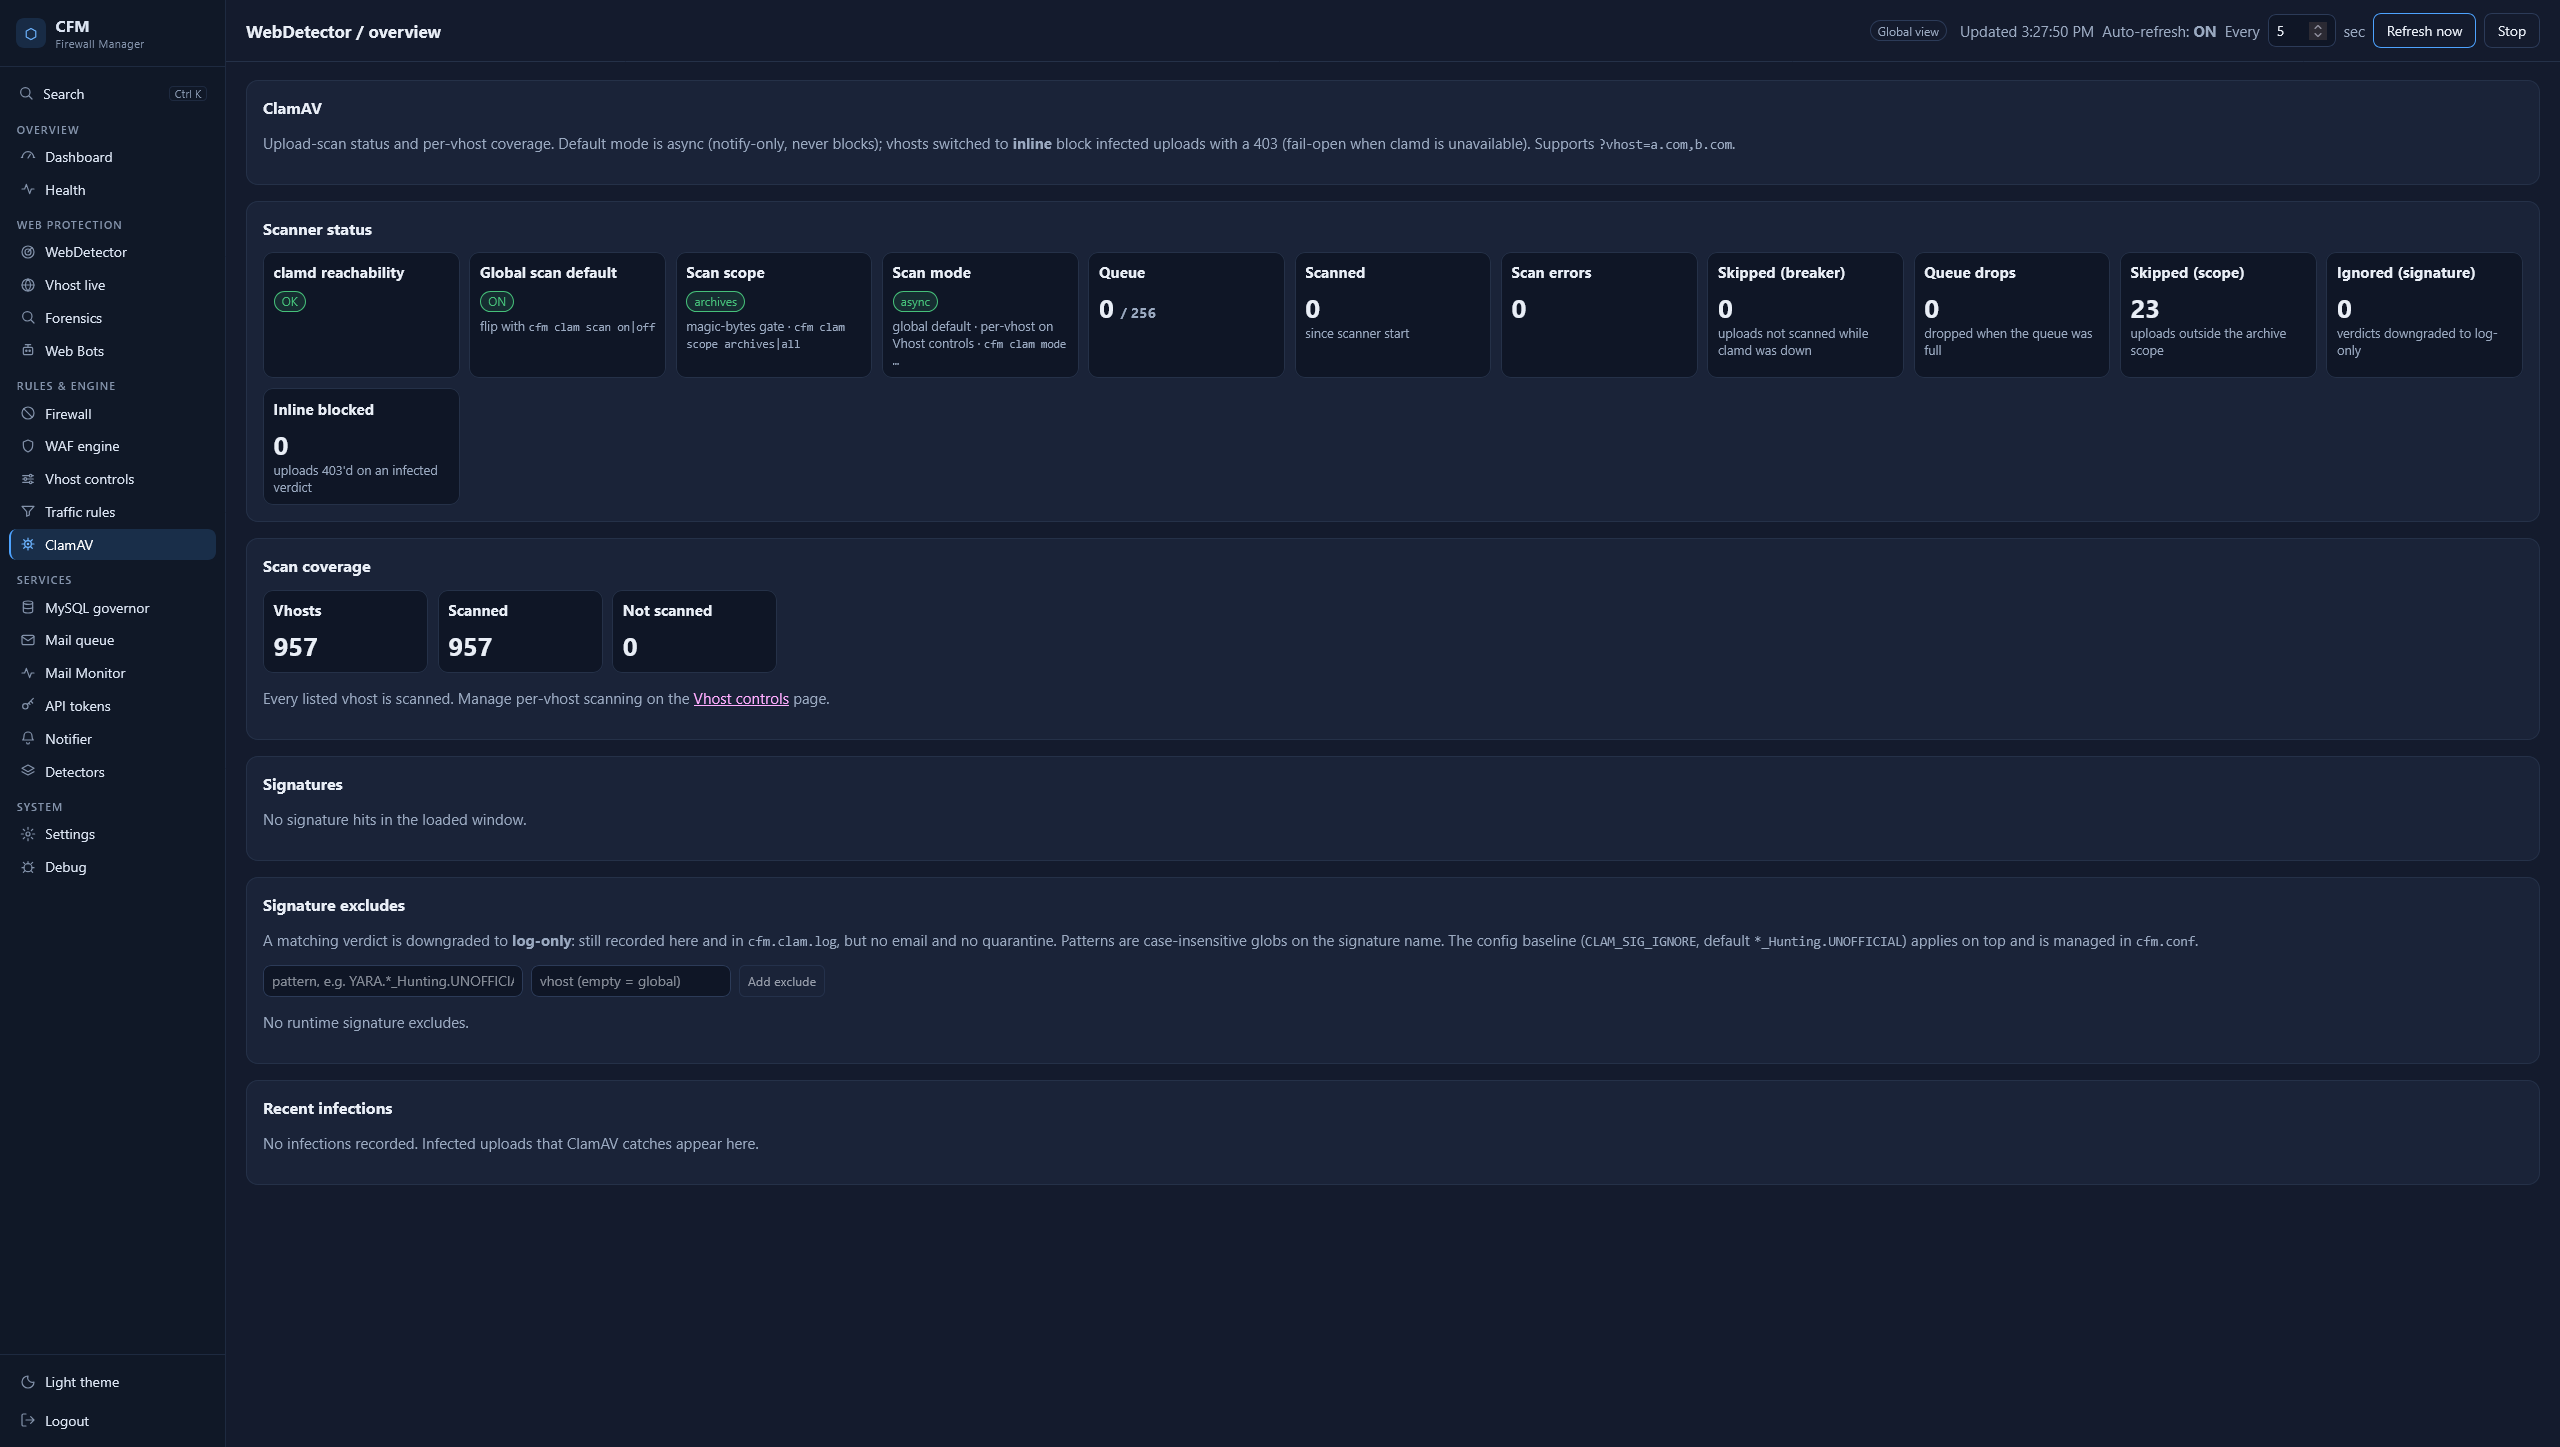
ClamAV bridge, with per-signature insights, one-click signature excludes, per-vhost scan coverage, a circuit breaker and a health prober. kernsec for kernel attack-surface reduction. MySQL governor for per-user DB pressure. Mail Monitor for outbound-abuse and compromised-account detection. And an MCP layer, so every read surface is queryable programmatically.
What it still doesn’t do
Same as every other post here: the gaps, stated plainly.
- The panel WAF is log-only. The cPanel/WHM/DirectAdmin listeners run the same ruleset the web edge does and record what they would do, but act on nothing. Zero lockout risk, zero enforcement. Turning it on is a later opt-in phase, after the false-positive data says it’s safe. I’d rather ship an honest probe than a confident block that locks an admin out of their own panel.
- No fleet view yet. Everything here is one node. Heartbeats now carry quick-glance vitals, which is Phase 1 of something — but today, N servers means N tabs.
- The light theme is a switch, not a design. It works. It hasn’t been loved.
- Access control is coarse. Admin and scoped viewer. There’s no per-page role model, and some of the “admin-only” decisions are per-endpoint judgement calls rather than a coherent permission system.
- It’s desktop-first. The dense tables that make it good at 3am on a laptop make it bad on a phone.
- Some pages are still too long. The WAF engine page scrolls a very long way. Splitting the pages that needed splitting doesn’t mean I got the boundaries right everywhere.
The takeaway
If there’s one thing to steal from this, it’s the split: decide, per page, whether it exists to be glanced at or to be worked in — and then be ruthless about it. Refresh rates, default filters, table density, whether actions live in rows or in a toolbar, even whether the page holds still under the cursor: all of it falls out of that one answer, and almost every UI mistake I made this cycle was a page trying to be both.
The second thing: measure what your own dashboard costs. Mine cost 543 GB of allocations an hour, and I only found it because the daemon it was watching started sweating.